Gustavo Hernández
Gustavo Hernández
Table of Contents
4 Wind electricity
generation – State of Art
5.1 Analysis of the wind available
technologies
5.2 Micro-generation promotion
5.4 Detailed analysis and specifications
5.4.6 Environmental considerations
5.4.11 On-roof downtown projects
6.1 Public safety considerations
7.4 Comparison of alternatives and
evaluation
7.4.4 Comparison – Conclusions on alternative scenarios
8.4.1 Emission, Economy Stimulation, Saved Energy and Job
Creation
Appendix A – Network development
Appendix B – Micro-generation growth in
Alberta
Appendix C – Summary of areas to consider
for wind generation turbines
Appendix D – History and Potential of
micro-wind turbines in North America
Appendix F – EROEI for different
technologies
Appendix G – Analysed wind turbines
Appendix I – NPP, SPP and Downtown Edmonton
Appendix K – Wind, buildings and turbulence
Appendix L – On-roof wind project around the
world
Appendix M – Solar Photovoltaic (PV)
analysis
M.3 Analysis of the technology in Alberta
M.3.6 Micro-generation promotion
Appendix N – Risk analysis for the
comparative alternatives
Appendix O – RETScreen Financial Analysis
comparison Wind Vs. Solar Panel
Appendix P – Business case with different
ROR and manpower considerations
Appendix Q – Risk assessment for the four
on-roof project alternatives
Appendix R – Business cases for the four
on-roof alternatives
AUC: Alberta Utilities Commission
DoE: DOE: Department of Energy
ERCB: Energy Resources Conservation Board
EROEI: Energy Return on Energy Investment
FAT: Factory Acceptance Test
GHG: Greenhouse Gases
GoA: GOA: Government of Alberta
GW: Giga Watt
GW/h: Giga Watt per hour
HAWTs: Horizontal Axis Wind Turbines
ktGHG: kilo tonne of GHG
kW: kilo Watt
kW/h: kilo Watt per hour
MG: Micro-generation
MGr: Micro-generator
MW: Mega Watt
MW/h: Mega Watt per hour
NPP: North Petroleum Plaza
OE: Office Ecology
OET: Office Ecology Team
PBL: Planetary Boundary Layer
PJ: Peta Joule
PJ/y: Peta Joule per year
PV: Photovoltaic or Solar Photovoltaic
SAT: Site Acceptance Test
SPP: South Petroleum Plaza
SWT: Small Wind Turbine
SWTS: Small Wind Turbine System
VAWTs: Vertical Axis Wind Turbines
W: Watt
Figure 4.1 HAWT turbines
Figure 4.2 VAWT turbines
Figure 4.3 Special design turbines
Figure 5.1: Noise sources in the
HWAT rotor plane
Figure 5.2: A
specification of up to 55 decibels (dBA) allows not to be intrusive and to work
under Edmonton city’s bylaw and international recommendations.
Figure 5.3: Time is service
probability as function of the wind speed on NPP roof.
Figure 5.4: Total estimation
installed height for the studied turbines
Figure 5.5: Wind
Frequency Orientation distribution for NPP location 50 m of altitude.
Figure 5.6: Wind
Frequency Speed distribution for NPP location at 50 m of altitude.
Figure 5.7: typical curves for different analysed turbines
and the annual wind speed frequency distribution on NPP.
Figure 5.8: Total energy
efficiency estimation for the analysed turbines considering the on-roof
application in NPP. The average value, 20.5%, is shown as the red line.
Figure 5.9: Cost of
wind project per kW of nominal capacity
Figure 6.1: view of
Edmonton City Airport and NPP and SPP buildings
Figure 7.1: milestones in
the development of the project
Figure 9.1: Total capital
expenditure and project present value as function of the kW installed (two
identical turbines).
Figure 9.2: Annual savings for wind
electricity generation is represented in the yearly money paid by the GoA. The
different curves represent different nominal wind turbine capacities.
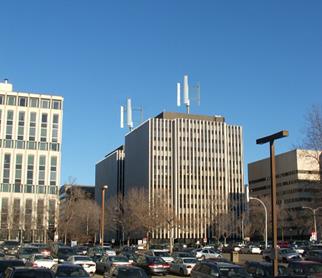
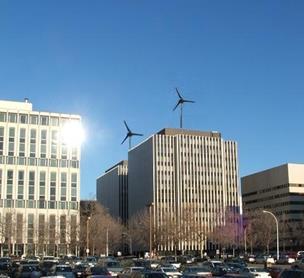
Figure I.1: Downtown Edmonton
Figure I.2: NPP and SPP buildings south east view
Figure I.3: NPP and SPP buildings south view
Figure I.4: NPP and SPP buildings south west view
Figure I.5: NPP and SPP buildings west view
Figure I.6: NPP and SPP buildings north-west view
Figure I.7: NPP and SPP buildings north view
Figure I.8: NPP and SPP buildings north east view
Figure I.9: NPP ground view
Figure I.10: area viewshed for the turbines
Figure I.11: The hub height under the turbine is negligible this
specification
Figure I.12: Minimum distance to perceive the
turbine
Figure K.1: Wind-obstacle interaction for the turbulence
formation and wind speed variation
Figure K.2: Neighbourliness consideration in the wind
profile modification
Figure K.3: NPP and SPP show a
relatively clean wind interaction with the neighbourhood buildings
Figure L.1: Examples of on-roof
turbines around the world
Figure M.1: PV cost evolution
Figure M.2: Cost of the electricity
by technology
Figure M.3: Visual impact of PV technology
Figure M.4: Solar radiation distribution around the
world
Figure M.5: Canada and Alberta solar radiation
distribution
Figure M.6: EPCOR headquarters PV installation
Figure M.7: PV project in the Alberta Legislature
Figure
O.1: Financial Analysis - Solar Panel project
Figure
O.2: Financial Analysis – Wind Project
Figure S.1: GoA alternative, it
takes around 476 business days to be completed
Figure S.2: Eng alternative, it
takes around 479 business days to be completed
Figure S.3: Com and Part
alternatives, they take around 396 business days to be completed
Table 4.1: Annual electricity and energy consumption in
Alberta for 2006 in different sectors [45]
Table 4.2: Annual electricity and energy consumption in
Alberta in 2008 [21]
Table 5.1: The following
table presents the average wind farms efficiency in 2007 [2] [80]
Table 5.2: Avian mortality by
technology
Table 5.3: GHG emission by
technology
Table 5.4: Micro-generation
shows great potential as job creator
Table 6.1: ISO 1996-1971
Recommendations for Community Noise Limits
Table 7.1: Sustainable ranking for
different technologies
Table 7.2: Assess impact
evaluation table
Table 7.3: Assess
impact evaluation for the different four alternatives
Table 7.4: Risk
assessment table
Table 7.5: Risk
assessment outcome for the four different alternatives
Table 7.6:
RETScreen summary for the ecominic comparison of the four alterantives
Table 7.7:
RETScreen summary for the ecominic comparison of the four alterantives.
Reasignation of funding
Table 8.1: Assess
impact outcomes for the four alternatives developing the on-roof project
Table 8.2: Risk
impact outcomes for the four alternatives developing the on-roof project
Table 8.3: Business
cases summary for the four wind on-roof project development alternatives
Table 8.4: Summary of energy and
emission to save by micro-generation technologies
Table 8.5: Summary of energy and
emission to save associated to this on-roof project
Table 8.6: schedule for the
development of the on-roof wind project for the four different alternatives
Table 9.1: GoA funding break down
Table 9.2: Minimal
specification for the turbines
Table A.1: Stakeholders summary
Table B.1: Micro-generation development in Alberta up to June 2009
under the new regulation
Table E.1: Comparison between HAWT and VAWT technologies
Table F.1: EROEI index for
different technologies
Table G.1: Summary of the studied
turbines
Table H.1: Common Noise Production Levels
Table M.1: Wind and PV technology development in
Alberta, Canada and the World
Table M.2: Summary of wind and PV technology
development in Alberta, Canada and the World
Table M.3: Summary of job creation rations for wind
and PV technologies
Table M.4: GHG emission for
different technologies in Alberta according to RETScreen software
Table
N.1: Risk analysis details for the four alternatives
Table
P.1: On-roof wind project, business case 1
Table
P.2: On-roof wind project, business case 2
Table
P.3: On-roof wind project, business case 3
Table
Q.1: Risk analysis details for the four in-roof wind alternatives
Table
R.1: Wind project cost estimations
Table
R.2: Energy and money saved over the time
Table
R.3: Money recovered over the time
Table
R.4: Summary of the business case for the DoE alternative
Table
R.5: Summary of the business case for the Eng alternative
Table
R.6: Summary of the business case for the Com alternative
Table
R.7: Summary of the business case for the Part alternative
Many people have participated directly or indirectly in this project.
We conducted consultation and discussions with stakeholders; this process was essential
for the development of this study, knowing the available technology and sensing
of the interest in the project. The technical specifications recommended are
based on these discussions trying to meet several requirements for the special
conditions of the project as well as to be the most practical and realistic
possible according to the available technology today.
The images in the study, except those where is shown NPP and SPP, were
obtained from Google images.
I'd like to thank people from OE Team that they collaborated polishing
this study, the associated presentations and they provided ideas and
information in the process of improvement (especially Carmen Gilmore, Chris
Arnot, Henry Dakurah, Kathleen Pate, Kristin Stolarz and Maurine Mullins).
Finally, I'd like to thank people from the GoA and CASA, who they allowed me to
work and present this project (Andrei Nikiforuk, Matthew Machielse, Tim Grant
and Kerra Chomlak).
This study represents the feasibility study for the development of the
wind turbine micro-generation project on roof buildings. The three main
objectives of the project is to provide a show case project supporting the
micro-generation development in Alberta, to show the commitment of the
Government of Alberta and the Department of Energy as well as leadership
initiatives in environmental friendly source of energies. This study represents
a guide and a point of start for the final project specifications. This
document is the support of the presentation document (Power Point and Executive
Summary) and it does not represent the final recommendations, which should be
reached with more extensive discussions.
This study was carry on during the term of almost one year, but it is
based on background experience and knowledge of the different actors that they
participated. During this year, the technology, economic conditions and more
have changed. The project, in any subject, was updated constantly during this
year based on new evidence and boundary conditions. Many cares was taken to
maintain the logic and congruent sequence of data, information and outcomes. In
case of errors, omission, unclear or uncompleted data or information, the
complete responsibility is assumed by the author of this study.
January 2010
Executive Summary
Objectives
This study examines
the promotion of micro-generation in Alberta through an inspiring example of
wind generation. In addition, the Department of
Energy (DOE) has the opportunity to demonstrate, once again, leadership and
commitment to energy management, technology development, environmental
protection and pro-active actions. Few opportunities are present over the time
to demonstrate all this commitments.
Background
Micro-generation is the term used to describe
generation of environmentally-friendly electricity on a small scale, i.e. for
individual customer use. Alberta’s Micro-generation Regulation (announced in February
2008 and in force in January 2009) is the set of rules that allows electricity
customers to generate their own environmentally friendly electricity and
receive credit for any power they don’t use and send back to the electricity
grid.
This
regulation is based in the promotion of renewable and alternative sources of
energy which present many benefits to society, market, environment, etc. These
benefits include: efficiency and conservation, environmental considerations,
business development, job creation, stabilizing electricity prices, decreasing requirements
for transmission lines, etc.
Recommendations and Conclusions
We
recommend that the DOE provide the funding and personnel to develop the wind micro-generation
project in Edmonton downtown, preferably in North Petroleum Plaza (NPP) and with
the cooperation of Alberta Environment in South Petroleum Plaza (SPP).
Alternative on-roof wind
partner development offers the best value for the DOE, taking into account all
factors: impact, risk, sustainability, investment, and investment recovery. Wind
generation affords meaningful, sustainable development, promotion of
micro-generation and positive impact on all stakeholders (including all Albertans).
It will demonstrate the Government’s commitment to bolstering micro-generation business
development in Alberta.
From a Government of
Alberta (GOA) perspective, this project presents a positive presence in the
Government core in downtown Edmonton, meets all the characteristics to promote
the use of micro-generation in Alberta, and shows the commitment of the DOE and
the GOA to efficient use of resources. In addition, the project presents a
positive present value in its life doing that the on-roof wind project will pay
for itself.
This document represents the feasibility study of the
on-roof wind generation facility based on NPP and SPP towers developed by the
DOE’s Office Ecology Team (OET).
The DOE has the
opportunity to model the efficient use of energy and available micro-generation
resources. This initiative develops a multiple gain scenario where multiple
players collect several benefits in a positive feedback:
-
Micro-generation promotion:
o
Improves the electricity generation
matrix in Alberta;
o
Promotes the use of alternative and
renewable sources of energy;
o
Promotes energy efficiency;
o
Helps reduce electricity costs;
o
Helps decrease electricity cost
volatility; and
o
Decreases energy losses in transmission
lines.
-
Social:
o
Helps educate citizens on Energy
Efficiency and Energy Conservation;
o
Increases micro-generation businesses;
o
Increases employment;
o
Increases community commitment and
awareness of energy efficiency and use; and
o
Increases Research and Development
(R&D) initiatives in Alberta;
-
Economics:
o
Saves money in Micro-generation
promotion and education;
o
Reduces electricity consumption in
the proposed buildings; and
o
As micro-generation technology:
-
Helps reducing wholesale electricity
price and volatility;
-
Increase the energy efficiency;
-
Helps in the development of micro-generation
businesses; and
-
Help in job creation at all levels
(research, management, maintenance, operation, administration, etc).
-
Environment:
o
Saves emission;
o
Promotes the use of renewable and
alternative sources of energy; and
o
Contributes to provincial targets
achievement in emissions reduction.
-
DOE and GOA:
o
Shows the commitment of DOE and GOA
through an inspiring example; and
o
Shows DOE and GOA are taking the
initiative in energy efficiency, renewable and alternative energy use, and energy
cost reductions that face Albertans.
The objective of this
analysis and comparison is to maximize the following:
1.
Promote micro-generation
2.
Improve energy use and conservation
3.
Promotion energy efficiency
4.
Promote Greenhouse Gas (GHG) emissions reduction
5.
Promote micro-generation business development
6.
Effective investment of government monies
7.
Risks minimization
8.
DoE and GoA commitment
9.
DoE and GoA initiative
Micro-generation is the term used to describe
generation of environmentally-friendly electricity on a small scale—for
individual customer use. In Alberta, micro-generation is one megawatt or less
of electricity generation that is connected to the distribution system.
Alberta’s Micro-generation
Regulation is the set of rules that allows electricity
customers to generate their own environmentally friendly electricity and
receive credit for any power they don’t use and send back to the electricity
grid. Appendix B presents details of micro-generation installation under this
regulation.
Micro-generation use produces significant positive
effects in energy use and in the electricity market:
·
Increases the efficiency in the residential sector
as well as energy use in rural areas.
·
Increases renewable and alternatives source of
energy. Micro-generation is the base of all the technologies allowed for
micro-generation and all of them help in emission reduction.
·
Decreases energy consumption: the so-called “second
effect” produces around a 6% decrease in electricity consumption due to
awareness around electricity use.
·
Decreases losses in transmission lines: electricity
is generated on site, eliminating the need for transmission lines (between the
6 and 8 % of the electricity generated in Power Plants is lost due transmission
and distributions lines losses).
·
Stabilizes and decreases the cost of the
electricity: on peak hour cost of electricity has a huge impact in daily
electricity price; micro-generation helps reduce on peak demand, and has a
secondary effect of increasing awareness in consumption along with reducing the
on peak electricity cost.
·
Micro-generation business: increase the number of
micro-companies offering for micro-generation technology, installation and
maintenance.
·
Although there is worldwide consensus in favour for the wind
generation development, many voices can be heard stressing the weaknesses of
wind generation technology such as increased electricity price, the need for backup
because of the unpredictability of the resource, etc. This awareness does not
apply for micro-generation due to the scale of the technology.
Over the years, the
worldwide contribution for the development of wind technology offers a
widespread technical possibility to use this technology for electricity
generation. Nowadays, there are wind turbines with a capacity of a few Watts (W)
to Megawatts (MW), turbines for applications in extreme weather conditions,
top-roof turbines, in a hill, on-shore and off-shore, etc.
In December 2008,
Canada counted with two Gigawatts (GW) of installed wind capacity [2],
increasing this number by 46% per year during the period of 2004-2008. Alberta is
one of the leaders in Canadian wind development with a capacity of 540 MW of
installed power capacity. In addition, Alberta had one of the better wind
capacity coefficients in Canada: 35% wind in 2007 and 32.4% in 2008 [2]. Finally,
the Alberta Electric System Operator (AESO) had 81 wind
projects in its queue in Alberta, representing nearly 11,714 MW [21].
If Alberta installed wind turbine in all appropriate sittings, Alberta’s
maximum estimated wind capacity, at the current technical development, is
400,000 MW with an electricity production of 2,100,000 GWh/y or 7,500 PJ/y. If
we compare these numbers with the annual electricity and energy consumption by
sector in Alberta, the importance in the development of this technology provincially
and country wide is evident.
|
Sector |
Annual electricity consumption [GWh] |
Annual energy consumption [PJ] |
|
Residential |
6,810 |
179 |
|
Transportation |
110 |
405 |
|
Industrial |
27,900 |
832 |
|
Commercial |
13,500 |
154 |
Table 4.1: Annual electricity and energy consumption in Alberta for
2006 in different sectors [45]
|
Item |
|
|
2008 Electricity Consumption [GWh] |
70,000 |
|
2008 Generation Capacity [MW] |
12,300 |
Table 4.2: Annual electricity and
energy consumption in Alberta in 2008 [21]
Different publications [12], [17],
[20],[26] and [28] analyse wind resources assessment models, site selection
models and aerodynamic models including wake effect, leading discussions about
existing performance and reliability evaluation models, various problems
related to wind turbine components (blade, gearbox, generator and transformer)
and the grid system development for integrating the wind energy system. In
particular [17] has an extensive database of referred studies for each concern
associated to wind technology.
Basically, two different
types of wind turbines exist, the horizontal and vertical axis wind turbines
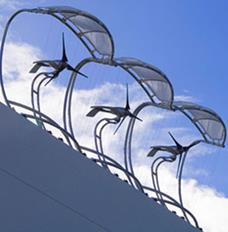
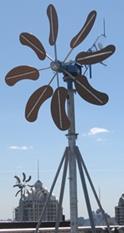
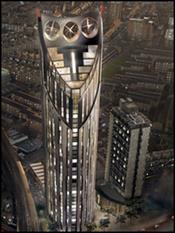
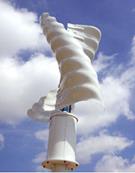
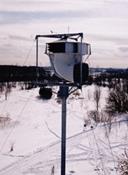
(HAWTs and VAWTs); the horizontal axis wind turbine is the most common type. Several
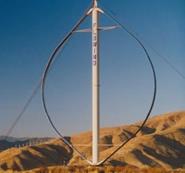
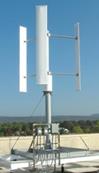
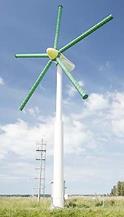
sub-classifications exist for them. Figures 4.1, 4.2 and 4.3 show the most
common turbine classification.
|
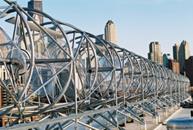
a) Classic |
b) On-roof design |
c) Multiple blades |
d) Integrated |
Figure 4.1: HAWT turbines
|
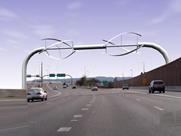
e) Helical |
f) L-shaped |
g) Darrieus |
h) H-rotor |
Figure 4.2: VAWT turbines
|
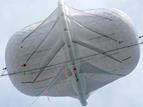
i) Magnus effect |
j) Floating |
k) Integrated |
l) Helical on-roof |
Figure 4.3: Special design turbines
The first windmill was a
VAWT; later HAWTs received most attention, but some scientists [32] claim that
the HAWT is not obviously better than the VAWT just because it was randomly
picked long ago for large-scale development.
Appendix C presents more
details in the analysis of wind turbines.
Evidence
indicates that people view small and large wind turbines the same even though
they have very different characteristics [82][83]. The technology principles are
the same, but both industries are different, with different boundary conditions,
cost, market and goals.
Small
Wind Turbines (SWT) are classified as:
·
Mini wind turbines with a rated power output from
300 W up to 1000 W (1 kW);
Capitalizing on the potential market in Alberta (not
possible in practical point of view nowadays) would result in the installation
of over 100 MW of Small Wind Turbines System and GHG emission reductions of
over 250 ktGHG per year [2]. Each MW of installed wind power in Alberta today, represents
an emission reduction of 2.5 ktGHG per year.
At the present, the market
for SWTs in Canada is relatively small, although it has experienced some growth
in the past five years [2]. A survey of retailers, distributors and
manufacturers of SWTs revealed the following:
·
Annual Sales. It
is estimated that current annual sales of SWTs are in the range of 600 to 800
units per year. This represents roughly $3.5 million in annual sales, including
$2.3 million for mini wind turbines and $1.2 million for small wind turbines.
Appendix D shows the evolution over the time of
micro-wind in North America.
There
is some concern in the use of HAWT technology for on-roof wind project. These
concerns focus on the effect of the turbulence on the turbine performance,
durability, control performance, maintenance cost, vibration, etc [36]. New
on-roof design for HAWT removes those weaknesses (figure 3.1-b), although some
projects were developed with success, the commercialization period of this
technology did not occur. VAWT technology overcomes most of those weaknesses,
but it adds others.
An
omni-directional turbine can be situated at places where the wind is turbulent
and where the wind  direction changes often. For this reason, VAWTs
have an advantage over HAWTs in high mountain areas, in regions with extremely
strong or gusty winds and in urban areas [35][37]. Investigations indicate a
clear advantage in using VAWTs at rooftops [36]. Furthermore, the VAWT is less
noisy than the HAWT, which becomes even more important in urban areas [35] as
well as less dangerous for birds [17].
direction changes often. For this reason, VAWTs
have an advantage over HAWTs in high mountain areas, in regions with extremely
strong or gusty winds and in urban areas [35][37]. Investigations indicate a
clear advantage in using VAWTs at rooftops [36]. Furthermore, the VAWT is less
noisy than the HAWT, which becomes even more important in urban areas [35] as
well as less dangerous for birds [17].
VAWTs
appear to be advantageous to the horizontal axis wind turbine in several
aspects for roof applications. Reports advise of the inconvenience to install a
HAWT on a building roof [36] due to high turbulence, less life of the turbines
and less energy production. However, the use of VAWT in cities has increased
due to the natural advantages of VAWT technology for this market sector. Around
the world, multiples studies have been conducted (Ontario [39], Brampton,
Canso, Kingston, Marathon, Wawa, Wolf [44], Germany [40]) and roof mounted
VAWTs have been proposed as part of the energy source for the Freedom Tower in
New York City [38].
The
vertical rotational axis of a VAWT allows the generator to be located at the
bottom of the tower. This makes installation, operation and maintenance much
easier. The tower can be lighter for a VAWT since the nacelle is excluded,
which reduces structural loads and problems with erecting the tower [41]. The
generator design can be focused on efficiency, cost and minimising maintenance.
Furthermore, the control system can also be located at ground level
facilitating access.
The
blades of a HAWT have to be self-supporting since they are only attached at the
root. The blades of a VAWT are supported by support arms, which usually are
attached to the centre of the blades. However, the support arms add extra
structure and mass to the turbine. For a larger blade area, more material is
used. Mass production of VAWT blades would imply low production costs since
their shape makes them easy to fabricate in large numbers compared to HAWTs
[41].
More
discussions about the HAWT and VAWT differences are exposed in Appendix E where
a summary is presented comparing HAWT and
VAWT technologies.
Wind technology
presents important characteristics in the promotion of micro-generation
technologies and renewable sources of energy.
The effect in the community
is extremely large at the start of the project, and it persists over time with
the same intensity for several generations. The movement, and its variation,
produces a double effect as it captures people’s attention to this technology.
To settle the wind
turbine in the downtown of a populous city stress significantly the promotion
of the technology and micro-generation as a general concept.
In 1919 the physicist Albert Betz
showed that for a hypothetical ideal wind-energy extraction machine, the
fundamental laws of conservation of mass and energy allowed no more than 16/27
(59.3%) of the kinetic energy of the wind to be captured [28][46]. This Betz' law limit can be approached by modern turbine designs which
may reach 70 to 80% of this theoretical limit.
Today, the available wind energy conversion
efficiency reaches about an average of around 40% in modern wind turbine types.
The common value for most of installation is between 30 and 35% in wind farm
and between 20 and 32 % for on-roof applications. Considering the losses due to
energy operation of the turbine components, this efficiency decreases in around
4 % more [35] [36] [37]. The following table presents the average wind farms
efficiency in Alberta, Canada and the World for 2007.
|
|
Alberta |
Canada |
World |
|
Wind
efficiency for electricity generation [%] |
32.9 |
32.8 |
34 |
Table 5.1: The following table presents the average
wind farms efficiency in 2007 [2] [80].
Another important
concept related to the efficiency of the different technologies is the called
The Energy Return on Energy Investment (EROEI) index; this index shows the
relationship between these two amounts of energy. Appendix F presents the EROEI
for different technologies for comparison; wind technology has an EROEI between
10 and 18.
Thirty-five different
turbines/technologies were taken as reference to compare and work in the
selection of specifications; the companies which provide these turbines
provided significant expertise, comments and discussion for the project
estimation (cost, time, risk, etc.) and stakeholder network development. The
summary of these turbines is presented in Appendix G.
Noise from wind turbines (when
active) may interfere with the lives of animals beneath the wind turbines. Wind
turbine noise is one of the major hindrances for the widespread use of wind
energy [8][77][78]. In order to reduce wind turbine noise the source mechanisms
must be known. For a modern large wind turbine, aerodynamic noise from the
blades is generally considered to be the dominant noise source, provided that
mechanical noise is adequately treated [11].
Due to the large number of
applications (e.g. wind turbines, airplanes, helicopters, fans), the
characteristics of airfoil noise have been investigated extensively in both
experimental and theoretical studies. Both inflow-turbulence and self-noise
mechanisms were considered and the dependence on parameters such as flow speed,
angle-of-attack, radiation direction, and airfoil shape was characterized.
These studies formed the basis of several semi-empirical wind turbine noise
prediction models, which were validated by comparison to field measurements.
Since the field results only provided the overall sound level of the turbine,
the relative importance of the different mechanisms was determined mainly on
the basis of the predictions. In some studies inflow-turbulence noise was
regarded to be the dominant source, while others considered trailing edge noise
to be dominant. In another case the turbine noise in different frequency ranges
was attributed to mechanical noise, trailing edge noise, tip noise, and
inflow-turbulence noise.
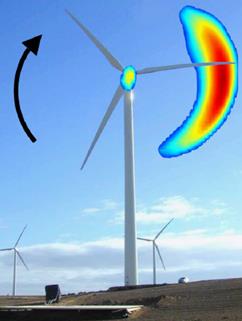
Figure 5.1: Noise
sources in the HWAT rotor plane.
In
[37] is reported a serious concern related with on-roof turbine and the noise
annoyance that they present. Appendix H presents the common noise production
levels.
The
VAWT technology, specifically the H-rotor turbine, is expected to produce much
less noise than a HAWT technology. There are two main sources for wind turbine
noise; aerodynamic noise from the turbine’s blade tips and mechanical noise
from the drive train components. The aerodynamic noise increases with
increasing blade tip speed of the turbine. A VAWT usually has a tip speed which
is approximately half the tip speed of a HAWT and it therefore produces less
aerodynamic noise. Since a VAWT has the drive train components at ground level,
the possible noise from these parts will not propagate as easily as when the
drive train components are situated on top of the tower. The VAWTs rotate
slower than a HAWT of the same size; it will therefore produce less noise than
the HAWT [17][41]. The following figures show the noise levels for two
different turbines; in the left side a VAWT turbine noise level is represented
(OE-8) and in the right side a HAWT turbine noise level is presented
(OE-1).
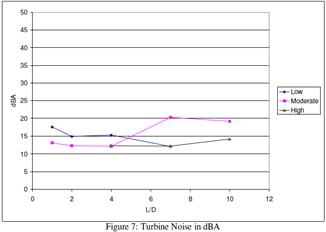
Figure 5.2: A specification of up to 55 decibels (dBA)
allows not to be intrusive and to work under Edmonton city’s bylaw and
international recommendations.
This is a subjective concept; the visual impact of wind farm is
considered positive (Prince-Edward Island [2]) in some regions but negative in
others (Gaspésie, Quebec [2]).
In the present project, the potential visual impact is inverted; the
showcase characteristics of this project convert the visual impact into a key
role in the project definition. The turbine design must harmonize in shape,
colour, wide, tall, etc. with the building and lateral buildings looking for
the most efficient and harmonious visual impact in the promotion of MG. The
swept area (area covered by the turbine in its rotation) of the turbine should
be enough to capture the attention of people.
Different studies show a detailed assessment in visual impact caused by
wind farms and off-shore projects [6] [7] [8] [58]; for on-roof turbine the
concerns focus on disrupting scenic of old, historical, community buildings,
etc. In the downtowns of modern cities, the concern is diluted by the
characteristics of the cities themselves (essentially moderns and tall
buildings).
The
first step in maximizing the on-roof wind positive visual impact is to map the
locations from which the turbines would be visible. These locations, defined as
the set of points from which an observer could see any of the turbines on a
clear day, are collectively known as the viewshed. Due to the NPP and SPP height
in comparison to neighbouring buildings, the turbines on-roof NPP and SPP do
not offer viewshed intersections with other buildings. Taller buildings in
downtown Edmonton do not need consideration because they are located as far as
one kilometre away. Taller buildings in downtown area are not allowed because of
Edmonton’s city airport. Appendix I presents figures that show the buildings
location in real proportion size in downtown Edmonton, as well as an analysis
of visual specifications.
A negative effect of wind turbine
visual impact showcase is the time during the turbine is not turning; a wind
turbine doesn’t turn all time. If the wind speed is slow, it doesn’t have
enough energy to move the turbine. This state represents a negative effect as
showcase. This minimum energy depends of multiples factors such as kind of
turbine, turbine power, installation, etc; the project design must maximize the
time that the turbine is spinning. The following figure shows the time in
service probability as function of the wind speed in on NPP roof for the four
seasons and the annual average. The figure shows that for example for a cut-in
of 3 m/s the turbine will be working around of 70% of the time during the
summer (17.8 hours per day) and 85% during the winter (20.4 hours per day).
Figure 5.3: Time is service
probability as function of the wind speed on NPP roof.
As summary for visual impact
specifications:
-
A swept area between 6.3 and 125 m2;
-
10 meters maximum height;
-
1.4 meters minimum turbine height (without hub);
-
The turbine colour must following Canadian Aviation Regulations; when
it is possible, it should be some colour
which maximizes the contrast with the white, grey and light blue colour of the
sky;
-
The turbine colour must following Canadian Aviation Regulations; when
it is possible, the turbine must have illumination during the night fed by the
same system (the light should be on when the turbine is spinning);
-
It should be study the psychological effect for the population in the
change of colour light if the turbine is spinning or not; and
-
Cut- in 3 m/s, maximizing the time turning of the turbine.
The following figure shows the
total estimation installed height for the studied turbines:
Figure 5.4: Total estimation
installed height for the studied turbines
The results of many studies [14][10][71] [72] [73]
[74] suggest that:
·
Wind
farms kill millions of birds yearly around the world, and the high mortality of
rare raptors is of particular concern; a greater kill of large birds, raptors and predators is detected in wind farms; raptors glide most of the time
to save energy and they use ascending air currents which often form along
slopes and ridges, where wind plants are often located for the same reason;
·
Wind
farms on migration routes are particularly dangerous, and it is difficult to
find a wind power site away from migration routes because there is no guarantee
that migration routes will not vary;
·
According
to the model of collision probability, the rotor speed does not make a
significant difference in collision probability; the hub is the most dangerous
part, and large birds (e.g. raptors) are at great risk;
·
based
on the field observation of squirrels’ vocalisation (i.e. anti-predator
behaviour), there are behavioural differences between squirrels at the wind
turbine site and those at the control site; and
·
Several
wind farms are erected in the way of migratory routes.
In [72], the researcher goes further and reaches a
relationship between bird fatalities and power generation for different
technologies. The author establishes the existence of the bird and bat
fatalities associated to wind farms, but he argues that this relative concept
changes when we compare the birds killed per kilowatt-hour for different
electricity generation facilities. For fossil fuel power plants the author
considers the bird killed in coal mining, plant operation, acid rain and
mercury. For Nuclear power plants, the author considers the uranium mining and
milling, and plant operation; the result is presented in the following table.
|
Facility |
Avian mortality per GWh |
|
Fossil fuel Power Plant |
0.200 |
|
Nuclear Power Plant |
0.416 |
|
Wind Farm |
0.269 |
Table 5.2: Avian mortality
by technology
The conclusion in aims to show that, instead of the
problems exist in wind farms, the effect is over dimensioned. For wind farms the
effect is magnified because the avian mortality occurs in a very small area. Another
interesting effect, based on the register following this problem, shows that
the avian fatalities are sensitive to time: birds often learn to avoid wind
farms after their first few years of operation.
A special concern is the slaughter of bats; the
University of Calgary has conducted studies due to the high rate of bats killed by certain turbines of
southern Alberta. The study determined that the vast majority of bats found dead below
turbines suffered severe injuries to their respiratory systems consistent with
a sudden drop in air pressure that occurs when the animals get close to turbine
blades. Several universities in Canada are studying procedures and mechanism to
diminish this slaughter of bats [85].
There are not conducted important studies on
slaughter of birds in on-roof wind turbine installations; due to low power
capacity, low swept area in on-roof project development and absence of the main
concern factors, the slaughter of birds doesn’t represent an issue for on-roof wind turbines.
In
relationship with the turbine technology, the VAWT is expected to be less
harmful for birds and bats, since the blades move at a slower pace and the
speed of the blade has been shown to affect the risk for collision greatly
[17][53].
Based on these studies, we can conclude that the
expected avian mortality for the on-roof project is almost null. If some
mortality occurs is more related with fatality than a strict correlation of the
factors.
In
[60][61][62] is presented both experimental and theoretical methods to study
the structural dynamic characteristics of rotor blades to avoid sympathetic
vibration problem. The test revealed that the natural frequencies of flap wise vibrations
are lower than that of the torsional vibrations; flap-wise vibration is the main
vibration of the rotor blade.
Cyclic stresses fatigue the blade, axle and bearing;
material failures were a major cause of turbine failure for many years. Because
wind velocity often increases at higher altitudes, the backward force and
torque on a HAWT blade peaks as it turns through the highest point in its
circle. The tower hinders the airflow at the lowest point in the circle, which
produces a local dip in force and torque. These effects produce a cyclic twist
on the main bearings of a HAWT. The combined twist is worst in machines with an
even number of blades, where one is straight up when another is straight down.
To improve reliability, teetering hubs have been used which allow the main
shaft to rock through a few degrees, so that the main bearings do not have to
resist the torque peaks.
When a HAWT turbine turns to face the wind, the
rotating blades act like a gyroscope [63][64]. As it pivots, gyroscopic
precession tries to twist the turbine into a forward or backward somersault.
For each blade on a wind generator's turbine, precessive force is at a minimum
when the blade is horizontal and at a maximum when the blade is vertical. This
cyclic twisting can quickly fatigue and crack the blade roots, hub and axle of
the turbines.
VAWT vibration is
originated by different physics principles due to the nature of the turbine.
More blades diminish vibration problems, but also decrease the turbine
efficiency.
All engines turning
have an inherent vibration problem, and all consequences associated to this
phenomenon. Special materials, sensors and theories to mitigate the problem
have been developed for hundreds of years. All this technology and procedures
are available today for simple turbines applications. However, heavy turbine
associated to vibration problems could produce important and quick damage in
the turbine basement.
For on-roof turbines,
especial considerations should be taken to avoid vibration transmission through
the building; these considerations should aim structural implications, turbine
life, people welfare and efficiency; real-time monitoring, periodic maintenance
and inspections are mandatory. The vibration transmission/isolation technology
is extremely well known, many industries face similar problems and hundreds of
instruments, software, theories and solution are available. Vibration
transmission to the building represents a problem in itself, but the solution
is available at all levels.
Often
the locations for wind turbines are in exposed locations where they are subject
to icing of the blades. Icing of wind turbine blades can cause a variety of
problems, such as complete loss of production, reduction of power due to
disrupted aerodynamics, overloading due to delayed stall, increased fatigue of
components due to imbalance in the ice load, and damage or harm caused by
uncontrolled shedding of large ice chunks [75][76].
The insect factor has a
similar effect for the wind turbine performance that icing, but it does not
involve public risk. Humid regions are more affected by this phenomenon and it
presents its own particularities. Insects prefer to fly in conditions of high
air humidity, low wind and temperatures above about 10° Celsius. Under these
circumstances, they will increasingly foul the leading edges of the blades.
Stall control is not very accurate in practical
application, and many stall-controlled turbines do not meet their
specifications. The power of wind turbines operating in high winds has been
known to drop for no known reason, causing production losses from 25 to 50%—a
phenomenon referred to as a ‘Double Stall’ or a ‘Multiple Stall’. Some
researchers [76] attributed this multiple power level occurrence to
the insect theory, which states that these levels correspond to different
degrees of insect contamination. A low contamination level decreases the power
by 8% of the design value; while at high levels it can be decreased by up to
55%. In this study a device called a ‘stall flag’ was employed a hinged flap
that opens up in a separated airflow to uncover an individual reflector.
Employing a projector as a light source, they
measured the separated flow from the intensity of reflected light.
The most common solution for reducing the effect of
insects and air pollutants on the blades is to wait for rainfall to wash the blades.
The disadvantage of this system is that the wind turbine must be stopped, so
the resulting power loss will simply add to the losses created by the insects.
Another blade washing technique involves pumping water up through the tower and
spraying it into the wind and through the blade tip, a solution that can be implemented
while the turbine is in operation.
Icing
and insect problems involve a maintenance requirement for the turbines. Because
the Edmonton region is could experience both problems, measures should be
specify for an on-roof turbine:
-
Periodic
maintenance during the periods with the temperature and humidity are
medium/high;
-
Periodic
maintenance, passive (e.g. dark colour for blades to absorb energy) and active
methods de-icing and/or anti-icing.
Furthermore,
problems with icing are less severe with a VAWT compared to a HAWT and less
security distance is required. This is due to the lower rotational speed of a
VAWT but also since an ice part that comes loose cannot get a velocity directed
upwards when leaving a VAWT, as could be the case with ice parts leaving a HAWT
blade.
Wind power consumes no fuel for continuing operation,
and has no emissions directly related to electricity production. Operation does
not produce carbon dioxide, sulphur dioxide, mercury, particulates, or any
other type of air pollution, as fossil fuel power sources do. Wind power turbines
consume resources in manufacturing and construction. As summary, the following
table presents the estimation in average GHG emission for different
technologies [81].
|
Technology |
g/kWh |
|
Coal |
850 – 1100 |
|
Coal with CCS |
85 – 220 |
|
NG Simple Cycle |
550 – 680 |
|
NG Combined Cycle |
400 – 520 |
|
Geothermal for
Electricity |
40 – 115 |
|
Biomass |
-40 – 40 |
|
Wind |
20 – 55 |
|
Photovoltaic |
40 – 120 |
|
Solar Thermal |
30 – 100 |
|
Nuclear |
20 – 35 |
|
Hydro-electric |
10 – 30 |
Table 5.3: GHG emission by technology
The GHG emission
intensity for the electricity industry in Alberta was 930 g/kWh in 2006 [84].
This means that 10 kW of installed wind power in
Alberta represents an emission reduction of 25.3 tGHG per year, this is
comparable to:
·
5 cars off of the road, or
·
300 fluorescent tubes less, or
·
5,100 toner cartridges not used,
or
·
4,500 people take the bus
between St. Albert and Edmonton, or
·
1,800,000 paper cups of coffee
not used, or
·
2,500,000 A4 sheets not used.
During manufacture of the wind turbine, steel,
concrete, aluminum and other materials will have to be made and transported
using energy-intensive processes, generally using fossil energy sources. The
initial energy "pay back" is claimed by one company to be within
about 9 months of operation for their offshore turbines and the British Wind
Energy Association claim the average wind farm will pay back the energy used in
its manufacture within 3 to 5 months of operation. However, a report to the
British House of Lords in 2004 suggested a payback time of 1.1 years, taking
into account factors such as plant construction and decommissioning. A shorter
period for offshore facilities was given, as the higher capacity factors would
more than offset the added energy costs of installation.
On-roof turbines do
not have environmental concerns for site installation, another impact which that
wind farms must consider.
The following table presents
the estimation in rate of job creation for some technologies [56] for big scale
applications; for micro-generation applications, the factor of increase is
between 10 and 15.
|
Renewable energy |
Construction & installation Ratio per [MWp] |
Operation & maintenance ratio per [MWp] |
|
Wind
|
1.5 |
0.3 |
|
Coal
fired Power Plant |
0.27 |
0.74 |
|
Biomass |
0.4 |
1.4 |
|
NG
fired Power Plant |
0.25 |
0.7 |
Table 5.4: Micro-generation shows great potential as job creator
The stochastic nature of wind is an important constraint
for wind projects and turbine design. The majority of today’s wind turbines
operate within the first 100 m of the earth’s surface. This region, which
occupies the lowest portion of the planetary boundary layer (PBL), is extremely
turbulent and driven by variations, which occur with the diurnal 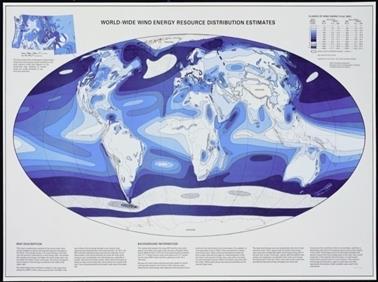 changes in the atmospheric
boundary conditions. The vertical variation of temperature and wind speed with height defines the PBL
behaviour characteristics. During normal daytime turbine operations, the
temperature normally decreases with height, which contributes to a convectively
unstable atmosphere. Under these conditions, the largest and most energetic
turbulent motions are associated with convective edges or cells that are many
times larger than even the largest wind turbines. The large eddies actively mix
with and absorb the smaller, more compact turbulent structures that have a more
direct impact on rotating wind turbine blades. These effects are increased in
cities were human activity means more temperature variations. Appendix
K presents more details.
changes in the atmospheric
boundary conditions. The vertical variation of temperature and wind speed with height defines the PBL
behaviour characteristics. During normal daytime turbine operations, the
temperature normally decreases with height, which contributes to a convectively
unstable atmosphere. Under these conditions, the largest and most energetic
turbulent motions are associated with convective edges or cells that are many
times larger than even the largest wind turbines. The large eddies actively mix
with and absorb the smaller, more compact turbulent structures that have a more
direct impact on rotating wind turbine blades. These effects are increased in
cities were human activity means more temperature variations. Appendix
K presents more details.
Canadian Wind Energy Atlas
[1] provides a database for the average wind frequency and direction for
Edmonton region. The available data is for three different altitudes: 30, 50
and 80 meters. This database does not take into consideration several
application factors such as wind interaction in urban areas, nozzle effect due
to buildings, turbulence, interaction between obstacles and obstructions, etc. According
to different publications [2][3][4], all those factors increase the wind turbulence
but decrease the average wind speed in building such as NPP and SPP. Based on
this conclusions the database for 50 m is taken.
Wind direction will
have also variations in relationship with the working database. This variation
will not be significantly affected due to the rotation capacity of each wind
generation unit, but it has an effect on the work and energy required in the
control orientation of the turbine.
Figure 5.5: Wind Frequency Orientation distribution for NPP
location 50 m of altitude.
Figure 5.6: Wind Frequency Speed distribution for NPP
location at 50 m of altitude.
Although the useful
database provided by [1], the urbane zone interaction generates distortions of
this frequency distribution and before to start the project measures during a
period of time the real conditions on top of the building is necessary. The
efficiency of the wind turbine is obtained through the composition between this
wind frequency speed distribution and the power curve of each turbine. To know
the real wind conditions on the roof of the building will allow selecting
better turbine and its better operating conditions.
One
of the significant measures of the cost effectiveness of a wind turbine is its
production of energy. In the design and analysis of wind turbines, the annual
energy output is calculated. Calculation of annual energy output requires
knowledge of the wind speed frequency distribution and the system power output
of the turbine as a function of wind speed. Furthermore, every prediction of
annual energy output is specific, depending on the local wind flow patterns and
turbulence and the local air density [19][21].
Turbine height was found
to have a significant effect on mean wind speed and power generated, while
output varied considerably with wind direction. The optimum mounting position
was also found to be dependent on the wind direction. If the probability of
wind flowing from all directions is similar, however, turbine location was
found to be unimportant provided that the turbine was located above roof
height. With a strong prevailing wind direction, optimum mounting position is
likely to vary.
Several factors affect the power
output and efficiency in electricity generation for a turbine; the most
important factor is the correct selection of the turbine for the wind
conditions in the site. The wind condition is a statistic result of the study
during a period of time in the exact location where the turbine will be
located. For on-roof projects, this study presents a big concern that must be
specially considered. Many factors affect the wind frequency distribution and
intensity in cities and they change over the time.
Urban wind monitoring projects in Europe, the UK
and the USA consider the future viability of roof-top turbines in urban houses,
the advantages and disadvantages of the systems, and compare yield and noise
from alternative models. The WINEUR project and Warwick wind trails are based on 21 building
mounted turbines each, while the Massachusetts trial is based on 19 small
turbines in urban locations [79]. Both the Warwick and Massachusetts projects
found that urban site conditions that reduce wind speed are not the sole reason
for low energy production. The accuracy of manufacturers’ power curves, losses
from balance-of-system components, and losses from additional site conditions
(such as very close obstacles causing turbulence and wind shear), have also
been identified as major causes. The balance-of-systems and effect of
turbulence/wind shear are estimated to reduce energy production by 10–15% and
15–30%, respectively. The following figure shows both
typical curves for different analysed turbines and the annual wind speed
frequency distribution for above NPP respectively.
Figure 5.7:
typical curves for different analysed turbines and the annual wind speed
frequency distribution on NPP.
The following figure shows the
estimated efficiency for each turbine in Edmonton NPP in on-roof project. This
efficiency takes into consideration the different loss of efficiency due to mechanical
and electronic losses in transmission, conversion, insects, ice, etc. The net
delivered energy by the turbine should be considered for comparison of
technologies, the development of the business case and any other study or
comparison.
Figure 5.8: Total energy
efficiency estimation for the analysed turbines considering the on-roof
application in NPP. The average value, 20.5%, is shown as the red line.
-
Total efficiency higher than 20% is anticipated for efficiency
specifications.
The overall cost for the wind turbine project is
determined by the manufacturing costs, the amount of captured energy, the cost
for site preparation and installation, the maintenance cost and the financing
cost [40]. It is measured in $/kWh. Technical factors such as the efficiency of
the turbine, the efficiency of drive train, generator and grid connection also have
an important impact on the cost.
When comparing the manufacturing costs of VAWTs and
HAWTs, consider that the HAWTs have been produced for a long time and are
produced in large numbers. As result smarter and cheaper solutions and the
large numbers produced decreases the price since parts can be mass produced.
Furthermore, as the technology has matured it has been possible to scale up the
HAWTs, lowering the cost per installed kW even more. No mass production of
VAWTs exists.
The difference in costs between VAWTs and HAWTs for
planning, producing, transporting and erecting a turbine and for operation and
maintenance (O&M) is mainly governed by the different costs for producing
the turbine and the costs for O&M with some exceptions; it might be easier
to erect the lighter tower of a VAWT, and it might be easier to transport the
shorter blades of a HAWT, whereas the curved blades for the Darrieus turbine is
very difficult to transport.
The efficiency for VAWTs is expected to nearly
reach efficiency values for HAWTs
[40]. The design of the H-rotor is based on simplicity. By omitting a yaw
system and the heavy nacelle and by having straight blades, the production
costs are lowered even though the H-rotor usually has longer blades than a
HAWT. For a Darrieus turbine, the blades are expensive to manufacture since
they are both long and bent and sometimes twisted. The cost analysis made by
Walters et al. [47] indicates
that VAWTs could be cost competitive to HAWTs.
The following figure shows the range of cost per kilowatt
nominal capacity:
Figure 5.9: Cost of wind project per kW of nominal capacity
Since
the majority of the world’s population lives in urban areas, implementing wind
turbines for electricity micro-generation for urban houses has the potential to
make a significant contribution to renewable energy targets. Micro-generation
at the single-building scale using roof-top wind turbines is one technology
being used on urban houses increasingly in European cities and just starting in
Canadian cities.
Typical roof-top turbine installations for houses
are rated at 3.5 kW or less. In Alberta, a 2.5 kW nominal capacity turbine is
enough to provide the consumed electricity for the average household. A study
of 21 roof-top turbine installations in Europe under the WINEUR project has revealed that the reasons
for installing turbines vary from educational (46%) and environmental (26%) to
improving the organisational image (20%). Thirty percent of these turbines were
installed in villages or country parks, while only 10% were installed in dense inner-city
locations [79].
To date the low development of roof-top turbines in
relationship with wind farms is related with the lower efficiency, high cost
per nominal kW for the small turbines, particularities for each application, and
a lack of policies that help with the development of the micro turbines market.
All these barriers are being minimized over time with the introduction and
development of new technology and adequate policies such as Alberta’s micro-generation
regulation.
Computer simulations used to study wind flow in an
urban area around an array of simple pitched-roof buildings, along with the
effect of potential turbine mounting position on the turbine output, found that
the behaviour of wind in a built-up area is different from that around an
isolated house. For example, the speed-up effect as wind passes over the ridge
of an isolated house is absent when the house is in an urban environment. Appendix
L summarizes different on-roof projects around the world.
Unlike
many conventional energy generating sites, on-roof wind turbines do not require
expensive decommissioning or remediation when they cease operation. Also, on-roof turbines are small turbines and their decommissioning
does not require special considerations.
Decommissioning will occur if leases are not
renewed at the end of the term. Full removal of all equipment and foundations
and the site remediation will be completed, to the satisfaction of the
landowner as stipulated in the lease agreement, and in compliance with all
federal, provincial, municipal and building regulations.
This
section identifies potential health and safety risks to the public from the
construction and operation of the Project.
Noise
With little consideration of low
frequency noise standards, which vary from country to country, the inadequacy
of Michigan’s wind turbine noise standard becomes apparent when reviewing
general noise level standards
for
community noise and wind turbine noise that have been adopted around the world.
The Michigan Wind Guidelines states 55 dBA. Michigan Standards also exceed
regulatory limits set in Denmark, the Netherlands, Germany and New Zealand,
which have not been included here.
|
District type |
Daytime limit [dBA] |
Evening limit [dBA] |
Night limit [dBA] |
|
Rural |
35 |
30 |
25 |
|
Sub-urban |
40 |
35 |
30 |
|
Urban residential |
45 |
40 |
35 |
|
Urban mixed |
50 |
45 |
40 |
Table 6.1: ISO 1996-1971 Recommendations for
Community Noise Limits
Icing
Icing presents an
important concern due to the weather conditions for the turbine location. The
lack of regulation about wind turbine icing presents more challenges for this
project located in Edmonton.
Aircraft
Routes
One
of the major constraints for developing the on-roof project in Edmonton
downtown is the aeronautical regulations due to the Edmonton City Centre
Airport. NPP and SPP are in the protected zone for air traffic and the
regulations introduce serious limitations in lighting, colour and maximum
height.
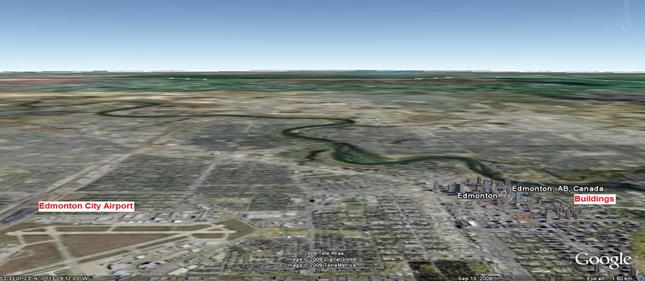
Figure 6.1: view of Edmonton
City Airport and NPP and SPP buildings
The
minimum distance between NPP and the south runways of the airport is around 2,500
meters. This is the minimum required distance for many security navigation
regulations. The analysis should carry on with precaution. The evaluation
process has already started.
The authorization request should be
completed for new structures only if:
·
The structure
is within six (6) kilometers of the center of an aerodrome, or two (2)
kilometers of a TC radar, radio navigation or radio communication antenna; or
·
The structure
exceeds twenty (20) meters in height, including catenary wire crossings; or
·
The structure
is within fifteen (15) meters and exceeds the height of a dominant structure
already in place.
Lightning
Due
to the height of the turbines, there is a potential for lightning strikes.
Navigation Canada provides the guidelines for lighting.
Transport Canada: http://www.tc.gc.ca/ontarioregion/civilaviation/aerodrome/documents/ObstructionclearanceForm.PDF
http://www.tc.gc.ca/CivilAviation/Regserv/Affairs/cars/PART6/images/g621s07.gif
http://www.tc.gc.ca/CivilAviation/Regserv/Affairs/cars/Part6/Standards/Standard621.htm
Aeronautic Act: http://laws.justice.gc.ca/en/A-2
Micro Generator Application - Process & Guidelines: http://www.auc.ab.ca/aucdocs/programs/MicroGen/Micro_Generator_Application_July%2018.pdf
Micro-generation
Regulation: http://www.auc.ab.ca/aucdocs/programs/MicroGen/Microgen_Regulation.pdf
FAQ: http://www.auc.ab.ca/aucdocs/programs/MicroGen/micro_gen_faq.pdf
Forms: http://www.auc.ab.ca/aucdocs/programs/MicroGen/Forms.doc
Wire
Service Provider: http://www.ucahelps.gov.ab.ca/9.html
Alberta
Transportation: http://www.transportation.alberta.ca/Content/docType329/Production/rdpapp.pdf
Hydro and
Electric Energy Act: http://www.qp.gov.ab.ca/documents/Acts/H16.cfm?frm_isbn=9780779730209 http://www.qp.gov.ab.ca/documents/Regs/1983_409.cfm?frm_isbn=0773236775
Legal Land Description: http://www.servicealberta.gov.ab.ca
The City of Edmonton
bylaw 14600 states the following limit for noise generation:
·
Daytime decibel limit – non residential:
o
75 dBA
between 7 a.m. and 10 p.m
o
80 dBA
lasting for a total period of time not exceeding two hours in any one day; or
o 85 dBA lasting for a total period of time not
exceeding one hour in any one day.
·
Overnight decibel limit – non residential:
o 60 dBA before 7 a.m. or after 10 p.m.
Based on the research done a wind turbine would not exceed
these limits.
Municipal
Affaires : http://municipalaffairs.gov.ab.ca/
Edmonton Airport:
Negotiations with the
building owner should be started one the project is approved. The project adds
value to the building (e.g. provide credit for LEED qualification), but studies
should be carry on to the changes in static and dynamic load in the building.
Four different
scenarios are proposed for a comparative analysis:
-
The first scenario is called status-quo; it represents not
developing any project and to promote MG through advertisement, brochures, etc.
as is the current practice.
-
The second scenario is called on-roof H/VWAT (On-roof wind);
it represents the development of on-roof project based on HAWT or VWAT
technology on NPP and SPP buildings (preferably but not limited to).
-
The third scenario is called HWAT (Ground wind), it represents
the development of windmill project on river ground.
-
The fourth scenario is called Solar Panel; it represents
the development of on-roof project based on Solar Photovoltaic (PV) panels on
NPP and SPP buildings (preferably but not limited to).
Researchers had
studied, proposed indexes and assessed the different renewable sources of
energy for electricity generation [29][30][48][49][50][51][52][53].
Some of these assessments could be applied for Alberta’s conditions in the
comparison for this project. In [29] [30] the non-combustion
based renewable electricity generation technologies were assessed against a
range of sustainability indicators, using data obtained from the literature. The
conclusion (Alberta conditions are usually worse for renewable electricity
production), according to the second paper our electricity generation is:
|
Technology |
Sustainable rankings |
|
|
Wind |
13 |
|
|
Hydro |
16 |
|
|
Solar |
20 |
|
|
Geothermal |
21 |
|
Table 7.1: Sustainable ranking for
different technologies
The conclusion of this paper shows
that wind technology has the best ranking assessment, followed by Hydro, PV and
Geothermal. PV has 54% worse ranking than wind technology for our climate and
location. Wind technology also shows better index in Price, GHG emission, availability
and limitations, efficiency, water consumption and social impact; the only
index that PV overcomes wind is in land use.
Quite often citizens,
journalists, policymakers and politicians are bombarded for information showing
the useful of solar technologies, geothermal for power, etc; usually, the
information does not include details which adapt the technology for Alberta conditions
(sun radiation intensity, grid emission, depth of resources, etc). Alberta’s
conditions are significantly worse for solar technologies than the average
condition studied in the assessment, and these indexes show more differences in
our country.
PV technology is an
excellent technology, but for very specials applications today. The future
appears to be better if some milestones are reached and barriers overtaken for
the development of the technology. Also, today this technology needs of
external conditions to see it massively used; one of the most important is the
increase of fossil fuel prices.
Nowadays, PV technology looks to be very expensive
and inefficient for common application in comparison to other technologies,
especially in Alberta (and Canada). PV systems offer the promise of clean and
plentiful energy, but they suffer a large handicap in that their cost is still
much too high. Nevertheless, during the 1980s and 1990s PV cell production has
been increasing on average by more than 15% per year.
Appendix M provides details of solar photovoltaic technology
analysis.
All scenarios must be
developed in similar and real conditions in Alberta regions, focusing on downtown
buildings in big cities. The magnitude of the evaluation is:
|
Negative |
|
Positive |
||||
|
High |
Medium |
Low |
Neutral |
Low |
Medium |
High |
|
-3 |
-2 |
-1 |
0 |
1 |
2 |
3 |
Table 7.2: Assess impact evaluation table
Where:
- High: impact is significant and stakeholders support and
preparation are critical
- Medium: manageable impact to the stakeholders
- Low: minor impact to the stakeholders
- None: stakeholders will not be impacted
|
Subject |
Stand-by |
Solar
Panels |
On
roof Wind |
Ground Wind |
|
Energy use and conservation |
0 |
1 |
2 |
1 |
|
Energy efficiency promotion |
0 |
1 |
2 |
1 |
|
GHG emission reduction |
0 |
1 |
2 |
2 |
|
DoE commitment and initiative |
-1 |
2 |
3 |
2 |
|
Micro-business development |
1 |
2 |
3 |
3 |
|
Show case for MG technologies |
0 |
1 |
3 |
3 |
|
Quality investment |
-3 |
-2 |
2 |
2 |
|
Risk |
0 |
-1 |
-1 |
-1 |
|
Impact Score |
-3 |
+5 |
+16 |
+13 |
Table 7.3: Assess impact evaluation for the different four
alternatives
Risk assessment consideration:
·
Probability
of risk:
o
High:
highly likely to occur
o
Medium:
likely to occur
o
Low:
not likely to occur
·
Impact
of Risk
o
High:
significant impact to the project
o
Medium:
impact the project
o
Low:
impact is relatively minor to the project
o
None:
will not impact the project
|
Impact |
High |
3 |
-3 |
-6 |
-9 |
|
Medium |
2 |
-2 |
-4 |
-6 |
|
|
Low |
1 |
-1 |
-2 |
-3 |
|
|
None |
0 |
0 |
0 |
0 |
|
|
|
|
-1 |
-2 |
-3 |
|
|
|
Low |
Medium |
High |
||
|
|
Probability |
||||
Table 7.4: Risk
assessment table
Appendix N presents
the detailed risk analysis for each alternative.
|
Risk Impact |
Stand-by |
Solar Panels |
On-roof Wind |
Ground Wind |
|
Total Risk |
-6 |
-26 |
-18 |
-18 |
Table 7.5: Risk assessment outcome
for the four different alternatives
RETScreen
software, by NRCan, provides a comparison tool between Solar Panel and Wind
alternatives. Appendix
O presents the RETScreen Finanacial analysis output.
|
Re-directing promotion budget |
Stand-by |
Solar Panels |
On-roof Wind |
Ground Wind |
|
Nominal capacity [kW] |
na |
8 |
8 |
8 |
|
Electricity generation [MW/y] |
na |
8.4 |
17 |
15 |
|
Total Initial Cost |
~40,000 |
83,764 |
59,499 |
57,720 |
|
Annual Cost |
0 |
220 |
300 |
300 |
|
Simple Payback [y] |
na |
54.1 |
17.2 |
16.1 |
|
Equity Payback [y] |
na |
35.4 |
14.2 |
13.4 |
Table 7.6: RETScreen summary for
the ecominic comparison of the four alterantives
As Wind
Turbines and Solar Panels contribute significantly to micro-generation
promotion, business cases are developed where the 75% of the micro-generation
funds for Stand-by alternative are used as promotion in the other alternatives.
|
Re-directing promotion budget |
Stand-by |
Solar Panels |
On-roof Wind |
Ground Wind |
|
Nominal capacity [kW] |
na |
8 |
8 |
8 |
|
Electricity generation [MW/y] |
na |
8.4 |
17 |
15 |
|
Total Initial Cost |
~40,000 |
53,764 |
29,499 |
27,720 |
|
Annual Cost |
0 |
220 |
300 |
300 |
|
Simple Payback [y] |
na |
54.1 |
17.2 |
16.1 |
|
Equity Payback [y] |
na |
35.4 |
14.2 |
13.4 |
Table 7.7: Reasignation of funding for the RETScreen summary for the ecominic
comparison.
The Assess Impact assessment shows that Wind Turbine is the
better project in comparison to Solar Panels and Stand-by alternatives.
|
Assess Impact |
Stand-by |
Solar Panels |
On-roof Wind |
Ground Wind |
|
Impact Score |
-3 |
+5 |
+16 |
+13 |
The Risk Impact assessment shows that Stand-by alternatives
has a lower risk, followed by Wind Turbine alternatives.
|
Assess Impact |
Stand-by |
Solar Panels |
On-roof Wind |
Ground Wind |
|
Total Risk |
-6 |
-26 |
-18 |
-18 |
Economic assessment
shows that Wind turbine alternatives are abetter as business case in comparison
to Solar Panels and Stand-by alternatives.
|
Economic assessment |
Stand-by |
Solar Panels |
On-roof Wind |
Ground Wind |
|
Nominal capacity [kW] |
na |
8 |
8 |
8 |
|
Electricity generation [MW/y] |
na |
8.4 |
17 |
15 |
|
Total Initial Cost |
~40,000 |
53,764 |
29,499 |
27,720 |
|
Annual Cost |
0 |
220 |
300 |
300 |
|
Simple Payback [y] |
na |
54.1 |
17.2 |
16.1 |
|
Equity Payback [y] |
na |
35.4 |
14.2 |
13.4 |
In conclusion, the
development of wind projects presents enormous advantages to Stand-by and Solar
Panel alternatives; on-roof wind project presents a small advantage in
comparison with ground wind project.
The project could be divided in mains stages:
|
Write RFP |
|
|
|
↓ |
|
|
|
Send the RFP to pre-selected companies |
|
|
|
↓ |
|
|
|
Evaluate proposals |
|
|
|
↓ |
|
|
|
Select the company to develop the
project |
|
|
|
↓ |
|
|
|
Sign agreement |
|
|
|
↓ |
|
|
|
Measure weather conditions in the
buildings |
Start with the development of the
project and construction of parts |
||
|
|
|||
|
↓ |
|
|
|
Installation |
|
|
|
↓ |
|
|
|
SAT- Commissioning |
|
|
|
↓ |
|
|
|
Decommissioning |
|
|
Figure 8.1: milestones in the
development of the project
Four development
alternatives for the project could be implemented:
1.
DoE: the project is managed
and supervised by DoE. Staff in the DoE manage and supervise each of the tasks described
above.
2.
Eng: the project
supervised by DoE by contracting an engineering company. The company manages and
supervises each of the tasks above. Staff in the DoE supervises the engineering
firm.
3.
Com: the project is supervised
by DoE under pre-agreement with a turbine builder or its representing company.
Agreement with a specialized company to develop the last four tasks above. Staff
in the DoE selects and supervises the company.
4.
Par: the project is supervised
by DoE under pre-agreement with a turbine builder or its representing company. Staff
in the DoE supervises the company. The company will recover part of the
investment by the saved energy during the lifetime of the project. The capital
expenditure will be minimal for the GoA.
All alternatives
present an opportunity for the company which develops the project to promote
their products and solution; this advantage is not analysed in the business
case and it is part of the foreseen negotiations with the company providing the
technology.
The comparison for
the three alternatives is:
|
Subject |
DoE |
Eng |
Com |
Part |
|
Wrote RFP |
0 |
1 |
2 |
2 |
|
sent the RFP to
pre-selected companies |
1 |
0 |
2 |
2 |
|
signed of agreement |
2 |
2 |
3 |
3 |
|
Measured weather
conditions in the buildings |
0 |
0 |
2 |
2 |
|
Project development |
1 |
2 |
3 |
3 |
|
Installation |
1 |
2 |
3 |
3 |
|
SAT- Commissioning |
0 |
0 |
1 |
2 |
|
Project time |
0 |
1 |
3 |
3 |
|
Government investment |
0 |
0 |
2 |
3 |
|
Continue efficiency |
1 |
1 |
2 |
3 |
|
Decommissioning |
0 |
0 |
0 |
0 |
|
Total |
+6 |
+9 |
+23 |
+26 |
Table 8.1: Assess impact outcomes for the four alternatives
developing the on-roof project
The risk assessment details
could be seeing in Appendix Q. The summary is presented here:
|
|
DoE |
Eng |
Com |
Part |
|
Total Risk |
-43 |
-37 |
-26 |
-18 |
Table 8.2: Risk impact outcomes for the four alternatives
developing the on-roof project
Appendix R presents
the business cases without consideration of the induced business development
and cost of manpower for the DoE.
The following
analysis considers several issues:
·
Cost of manpower, administrative and professional, for the GoA
in the development, supervision, administration and inspection of the project;
·
The revenue generated by the promotion of the technology
across the province. One of the most important goals for this project is
micro-generation promotion in Alberta. This promotion stimulates the
development of projects, which generate revenue for the government in two ways:
corporate income tax and personal income tax through workers.
Considering:
·
VAWT cost turbine (HAWT has a capital cost 5 to 15% lower)
·
Nominal Capacity: 6 kW
·
Turbines: 2, one on each building
·
Net Efficiency: 20%
·
Cost of the project: 8,570 $/kW
·
Maintenance cost: 800 $/y (DoE and Eng); 400 $/y (Com) and
250 $/y (Part)
·
Inflation: 2.3%/y
·
Increase COE : 2.3%/y
·
Rate of Return: 9%
·
Final COE : 0.12 $/kW
·
Life time: 25 years
·
Decommissioning: $7500 plus $1250/kW
·
Incenting the development of 10 micro-generation projects
per year:
|
Technology |
Cost [$/kW] |
Emission [Kg/MWh] |
Efficiency [%] |
Job Creation [jobs/MWp] |
|
|
Installation |
Maintenance |
||||
|
Wind |
7,000 |
40 |
25 |
1.5 |
0.3 |
|
Solar |
11,000 |
60 |
10 |
5.9 |
3.0 |
|
Other |
12,000 |
150 |
30 |
0.4 |
1.2 |
·
Job creation factor for micro-generation applications: 12.5
·
Induced application per year: 3.9 (8% of the total
micro-generation applications)
·
Nominal Capacity induced applications: 4.25 kW (average
capacity installed up to day)
·
Income TAX Recovery: 2.13%
·
Provincial Personal Income Tax: 6.07%
·
Average worker salary: 50,000 $/y
Appendix R presents
the detailed calculations for the business case (CO2 savings are not
considered); as summary:
|
PV values [$] |
DoE |
Eng |
Com |
Part |
|
Maintenance
cost |
(10,000) |
(10,000) |
(5,000) |
(3,000) |
|
Capital Expenditure |
(103,000) |
(153,000) |
(103,000) |
(73,000) |
|
GoA Manpower cost |
(73,000) |
(43,000) |
(34,000) |
(34,000) |
|
Decommissioning |
(4,000) |
(4,000) |
(4,000) |
(4,000) |
|
Energy saving |
30,000 |
30,000 |
30,000 |
0 |
|
Tax Recovery |
178,000 |
178,000 |
178,000 |
178,000 |
|
CO2 saving |
3,000 |
3,000 |
3,000 |
3,000 |
|
Project PV |
18,000 |
(2,000) |
62,000 |
64,000 |
Table 8.3: Business
cases summary for the four wind on-roof project development alternatives
The development of an on-roof project has several
additional gains for the GoA. Because of the promotion and incentive in the
application of micro-generation technology, new developments will be induced;
these developments create business, jobs and help to increase the micro-generation
benefits (more electricity, less emissions, more efficiency, etc.).
Under the developed business case, the induced
benefit for this project over 20 years is:
|
|
1 |
2 |
3 |
4 |
5 |
6 |
….. |
20 |
|
Saved
emission [tGHG] |
42 |
41 |
40 |
40 |
39 |
38 |
….. |
21 |
|
Accumulated
saved emission [tGHG] |
42 |
84 |
124 |
164 |
203 |
241 |
….. |
650 |
|
Saved
energy [MWh] |
47 |
47 |
47 |
47 |
47 |
47 |
….. |
47 |
|
Accumulated
saved energy [MWh] |
51 |
102 |
153 |
203 |
254 |
305 |
….. |
1,015 |
|
Created
Jobs |
1.1 |
1.4 |
1.8 |
2.1 |
2.4 |
2.8 |
….. |
7.5 |
|
Generated business [M$] |
0.28 |
0.18 |
0.18 |
0.19 |
0.19 |
0.20 |
….. |
0.27 |
Table 8.4: Summary of energy and emission to save by
micro-generation technologies
For the micro-generation business the benefit for
this project over 20 years is:
|
|
1 |
2 |
3 |
4 |
5 |
6 |
….. |
20 |
|
Saved
emission [ktGHG] |
1.0 |
1.0 |
1.0 |
1.0 |
1.0 |
1.0 |
….. |
0.8 |
|
Accumulated
saved emission [ktGHG] |
1.0 |
2.0 |
2.9 |
3.9 |
4.9 |
5.9 |
….. |
18.3 |
|
Saved
energy [GWh] |
1.1 |
1.1 |
1.1 |
1.2 |
1.2 |
1.2 |
….. |
1.7 |
|
Accumulated
saved energy [GWh] |
1.2 |
2.4 |
3.6 |
4.9 |
6.2 |
7.5 |
….. |
29.6 |
|
Created
Jobs |
46 |
61 |
77 |
93 |
109 |
126 |
….. |
407 |
|
Generated
business [M$] |
6.4 |
6.5 |
6.7 |
6.8 |
7.0 |
7.1 |
….. |
9.8 |
Table
8.5: Summary of energy and emission to save associated to this on-roof project
Appendix S presents
the details in the project schedules. The summary is shown in the following
table.
|
|
DoE |
Eng |
Com |
Part |
|
Time
[business days] |
476 |
479 |
396 |
396 |
Table 8.6: schedule for the development of the on-roof wind
project for the four different alternatives
We recommend that the Department of Energy choose Alternative On-roof
wind project. The project reaches all the goals for the Office Ecology Team in
the promotion of micro-generation technology in Alberta giving the GoA the
initiative and commitment in the development of renewable source of energy and
energy efficiency.
In addition, the developed business case shows that the project is
profitable for the GoA, recovering the investment through the incentive of
business development, personal income tax and business taxes.
For the four alternatives considered in the development of the project,
we recommend Alternative 4 “Partner”, which means to evaluate and negotiate
with a pre-qualified company the development of the project. This approach
represents the most efficient way to develop the project with a minimum capital
expenditure, minimum maintenance cost, minimum risk and maximum efficiency over
the time. Alternative 3 “Com” presents a slight risk in comparison with
Alternative 4, but it is considered the second best option.
The funding breakdown based on 2 turbines, with 6 kW nominal capacity for
each one, remains:
|
6 kW turbine |
Year 0 |
Year 1 |
Year 2 |
Year 3 |
….. |
Year 20 |
|
Capital Expenditure |
64,000 |
|
|
|
|
|
|
GoA Manpower |
34,000 |
250 |
250 |
250 |
|
250 |
|
Payment for Energy saving |
|
2,520 |
2,580 |
2,640 |
….. |
3,890 |
Table 9.1: GoA funding break down
And the financial outcomes
|
6 kW turbine |
Outcomes |
|
Project Present Value [$] over
the 25 of the project life [$] |
66,000 |
|
Project Simple Payback [years] |
14 |
Figure 9.1: Total capital
expenditure and project present value as function of the kW installed (two
identical turbines).
Figure 9.2: Annual savings for wind
electricity generation is represented in the yearly money paid by the GoA. The
different curves represent different nominal wind turbine capacities.
The global technical recommended specifications are, but not limited to:
|
Item |
Specification |
Unit |
|
Turbine - first option |
VAWT |
|
|
Alternative |
HAWT |
|
|
Nominal capacity |
3 to 8 |
kW |
|
Cut-in |
3 |
m/s |
|
Net efficiency |
≥ 20 |
% |
|
Noise |
≤ 50 |
dBA |
|
Weight |
≤ 500 |
Kg |
|
Height |
≥ 2; ≤ 10 |
m |
|
Swept area |
≥ 6.3; ≤ 125 |
m2 |
|
Vibration |
Continue monitoring;
vibration damper according to building specification |
|
|
Foundation |
Insulating |
|
|
Slaughter of bird |
NA |
|
|
Anti-icing equipment |
Yes |
|
|
Insects |
NA |
|
|
Interconnection |
On-grid |
|
|
SCADA system |
Current, historic and
trend data for inverter variables, vibration sensors, etc. |
|
Table 9.2: Minimal specification for the turbines
At least nine analysed turbines could reach these
specifications (OE-5, OE-7, OE-8, OE-21. OE-22, OE-24, OE-26, OE-27, OE-29);
this number could increase due to continued improvements in the development of
micro-turbines as well as new available turbines in the market.
[1] Canadian
Wind Energy Atlas [online], http://www.windatlas.ca/en/index.php (web site consulted on December 23, 2008)
[2] Canadian Wind Energy Association [online], http://www.canwea.ca/ (web site consulted on December 22, 2008) and monthly
newsletters.
[3] Hughes, M. et al, Influence of Tower Shadow and Wind
Turbulence on the Performance of Power System Stabilizers for DFIG-Based Wind
Farms, IEEE Transactions on Energy Conversion, Vol 23, N. 2, June 2008, pp. 519-528
[4] Bekele, G et al, Wind energy potential
assessment at four typical locations in Ethiopia, Applied Energy Journal (2009)
pp. 388–396
[5] Tanaka, S et al, Wind
effects on noise propagation for complicated geographical and road
configurations, Applied Acoustics Journal (2008) pp.1038–1043
[6] Tsoutsos, T et al, Visual impact evaluation of
a wind park in a Greek island, Applied Energy Journal (2009) 546–553
[7] Ladenburg, J. Visual
impact assessment of offshore wind farms and prior experience, Applied Energy
Journal (2009) 380–387
[8] Pedersen, E. et al,The impact of visual factors on noise annoyance among
people living in the vicinity of wind turbines, Journal of Environmental
Psychology (2008) 379–389
[9] Benitez, L et al, The
economics of wind power with energy storage, Energy Economics Journal, 2007
[10] Bright, J et al, Map
of bird sensitivities to wind farms in Scotland: A tool to aid planning and
conservation, Biological Conservation (2008) pp. 2342-2356
[11] Oerlemans, S, et al, Location and
quantification of noise sources on a wind turbine, Journal of Sound and
Vibration (2007) pp. 869–883
[12] Eriksson, S. et al,
Evaluation of different turbine concepts for wind power, Renewable and
Sustainable Energy Reviews (2008) pp. 1419–1434
[13] Filios, A. et al,
Broadband noise radiation analysis for an HAWT rotor, Renewable Energy Journal
(2007) pp. 1497–1510
[14] Kikuchi, R., Adverse
impacts of wind power generation on collision behaviour of birds and
anti-predator behaviour of squirrels, Journal for Nature Conservation (2008)
pp. 44—55
[15] Brown, M. et al,
Experimental and Model-Computed Area-Averaged Vertical Profiles of Wind Speed
for Evaluation of Mesoscale urban Canopy Schemes. American Meteorological
Society. (http://ams.confex.com/ams/pdfpapers/105229.pdf) (web site consulted on December 29, 2008)
[16] WINEUR
- Wind energy integration in the urban environment, European Commission under Intelligent Energy – European programme (http://www.bwea.com/pdf/small/wineur.pdf), (web site consulted on December 29,
2008)
[17] Herbert, G.M. et al, “A review of wind energy technologies”
Renewable and Sustainable Energy Reviews Journal, (2007) pp. 1117–1145
[18] Wood DH.
Determination of the optimum tower height for a small wind turbine. Int J REE
2001;3(2):356–9.
[19] Burton T, Sharpe D, Jenkins N, Bossanyi E.
Wind energy handbook. New York: Wiley; 2001. p. 531–3.
[20] Eriksson, S. et al, Evaluation of different turbine
concepts for wind power, Renewable and Sustainable Energy Reviews Journal,
2008, pp. 1419–1434
[21] Calgary Herald, December 17, 2008
[22] Ontario Power Authority, [online] http://www.powerauthority.on.ca/sop/Page.asp?PageID=122&ContentID=4045 (page consulted on December 18, 2008)
[23] Ontario Power Authority, [online] http://www.powerauthority.on.ca/sop/Page.asp?PageID=122&ContentID=4022&SiteNodeID=250 (page consulted on December 18, 2008)
[24] Malcolm DJ. Modal
response of 3-bladed wind turbines. J Sol
Energy Eng 2002;124:364–71.
[25] Ackermann, T. et al, An assessment on seasonal analysis of wind energy
characteristics and wind turbine characteristics, Energy Conversion and
Management Journal (2005), pp. 1848–1867
[26] Ackermann, T. et al, An overview of wind
energy-status 2002, Renewable and Sustainable Energy Reviews Journal (2002) pp.
67–128
[27] Sanchez, I. Short-term
prediction of wind energy production, International Journal of Forecasting 22
(2006) pp. 43– 56
[28] Ozgener, O., A small wind turbine system (SWTS)
application and its performance analysis, Energy Conversion and Management
Journal (2006) pp. 1326–1337
[29] Kaldelli, J. et al, Comparing wind and photovoltaic
stand-alone power systems used for the electrification, Renewable and
Sustainable Energy Reviews (2007) pp.
57–77
[30] Evans, A. et al, Assessment of sustainability
indicators for renewable energy technologies, Renewable and Sustainable Energy
Reviews, RSER-558; 7 p.
[31] Anon.2. Technical
Sheet of THERMIE Project Renewables Wind Energy (RWE-8). Contract no:
WE/00010/91/DE. Project end date: 31/08/1994. OPET Sweden, Drottninggatan 50,
111 21 Stockholm, Sweden
[32] Charlier RH. A, ‘‘sleeper’’ awakes: tidal
current power, Renew Sustainable Energy Rev 2003, pp 515–29
[33] Manwell JF, et al Wind energy explained, 1st
ed. Amherst, USA: Wiley; 2002
[34] Muljadi E, et al,
Control strategy for variable-speed, stall-regulated wind turbines. National
Renewable Energy Laboratory 1989; NREL/CP-500-24311-UC Category: 1211
[35] Riegler H. HAWT
versus VAWT: small VAWTs find a clear niche. Refocus 2003;4(4):44–6.
[36] Mertens S. The energy
yield of roof mounted wind turbines. Wind Eng 2003;27(6):507–18.
[37] Encraft, Warwick Wind
Trials Report 2009 - www.encraft.co.uk
[38] Knight J. Urban wind
power: breezing into town. Nature 2004;430(6995):12–3.
[39] SWT Pilot Program – Hamilton,
[online] http://www.myhamilton.ca/NR/rdonlyres/F5FF1B05-3F55-4686-A521-7DE581C43926/0/Aug09PW06093.pdf (page consulted on January 6, 2009)
[40] Neuhäuser, [online] http://www.neuhaeuser.com/windenergie/video/STROM_AUS_WIND_dsl2.wmv (page consulted on December 18, 2008)
[41] C. Brothers. Vertical
axis wind turbines for cold climate applications. Montreal, Canada. Renewable
Energy Technologies in Cold Climates ’98 International Conference.
[42] TMA, [online] http://www.tmawind.com/ (web site consulted on January 15, 2009)
[43] Cleanfield Energy,
[online] http://www.cleanfieldenergy.com/ (web site consulted on November 24, 2008)
[44] Federation of
Canadian Municipalities, [on line] http://gmf.fcm.ca (web site
consulted on February 4, 2009)
[45] Statistic Canada, [on
line] http://www.statcan.gc.ca/ (web site consulted till March 2009)
[46] National Renewable
Energy Laboratory, [on line] http://www.nrel.gov/wind (web site consulted till March 2009)
![]()
[47] WhalePower, [on line]
http://www.whalepower.com/ (web site consulted on February 2009)
[48] National Research Council
of the National Academies, Environmental Impacts of Wind-Energy Projects, May
2007, 278 p.
[49] Xing, Y. et al, A
framework model for assessing sustainability impacts of urban development,
Accounting Forum (2008) ACCFOR-154; 16 p.
[50] Marull J. et al, A
Land Suitability Index for Strategic Environmental Assessment in metropolitan
areas, Landscape and Urban Planning, 2007,
pp. 200–212
[51] Kumar Singh R. et al, An
overview of sustainability assessment methodologies, Ecological Indicators,
2009, pp. 1 8 9 – 2 1 2
[52] Karavanas, A. et al,
Evaluation of the implementation of best available techniques in IPPC context an
environmental performance indicators approach, Journal of Cleaner Production,
2008, 7 p.
[53] Moles, R. et al, Practical
appraisal of sustainable development—Methodologies for sustainability
measurement at settlement level, Environmental Impact Assessment Review, 2008,
pp. 144–165
[54] PV Resources, [on
line] http://www.pvresources.com (web site consulted on February 22, 2009)
[55] Climate Change
Central – Alberta Solar Municipal Showcase, [on line] http://www.lassothesun.ca/ (web site consulted on February 21, 2009)
[56] WorldWatch Institute
– Green Jobs Initiative, Green Jobs: Toward Sustainable Work in a Low-Carbon
World, Preliminary Report, December 2007
[57] U.S. Department of
Commerce – National Technical Information Service, Determination of Effects of
Atmospheric Contamination of Photovoltaic Cells in Concentrating Systems, 1986
[58] Arons, S., Energy
Yield and Visual Impact Studies of the Berlin Wind Project, Williams College,
Williamstown, Massachusetts, 12 May 2004
[59] Sagan, C., Dragons of Eden, Ballantine Books; Reprint edition (1986), ISBN-10: 0345346297, 288 pp
[60] Mroz, A. et al, Full-scale
measurements and numerical evaluation of wind-induced vibration of a 63-story
reinforced concrete tall building, Computers and Structures
Journal (2008) pp. 217–226
[61] Larsen, J. et al, Non-linear dynamics of wind turbine wings,
International Journal of Non-Linear Mechanics (2006), pp. 629 – 643
[62] Sun, D. et al, Application of the k–w turbulence model for a wind- induced vibration
study of 2D bluff bodies, Journal of Wind Engineering and Industrial
Aerodynamics, article in press (2008)
[63] Fisher, O. Wind-excited
vibrations—Solution by passive dynamic vibration absorbers of different types, Journal of Wind Engineering and Industrial
Aerodynamics (2007) pp. 1028–1039
[64] Larsen, J. et al, Nonlinear parametric instability of wind turbine
wings, Journal of Sound and Vibration (2007) pp. 64–82
[65] Guerard, K. et al, The
processing of spatial information in short-term memory: Insights from eye
tracking the path length effect, Acta Psychologica (2009) article in press
[66] Reyes, M. et al, Effects
of cognitive load presence and duration on driver eye movements and event
detection performance, Transportation Research Part F 11 (2008) pp. 391–402
[67] Näsäsen, R. et al, Effect
of stimulus contrast on performance and eye movements in visual search, Vision
Research (2001) pp. 1817–1824
[68] Rayner, K. et al, Eye
movements during information processing tasks: Individual differences and
cultural effects, Vision Research (2007) pp. 2714–2726
[69] Jarozka, H. et al, In
the eyes of the beholder: How experts and novices interpret dynamic stimuli,
Learning and Instruction (2009) article in press
[70] Muggleton, N. et al, Human
frontal eye fields and target switching, Cortex (2009), doi:
10.1016/j.cortex.2009.01.011
[71] Masden,
E. et al. Cumulative impact assessments and bird/wind farm interactions:
Developing a conceptual framework, Environmental Impact Assessment Review
(2009), Article in Press (EIR-05606)
[72] Sovacool, B.
Contextualizing avian mortality: A preliminary appraisal of bird and bat
fatalities from wind, fossil-fuel, and nuclear electricity, Energy Policy
Journal 37 (2009) pp. 2241–2248.
[73] Kikuch, R. Adverse impacts
of wind power generation on collision behaviour of birds and anti-predator
behaviour of squirrels, Journal for Nature Conservation 16 (2008) pp. 44-55.
[74] Desholm,
M. Avian sensitivity to mortality:
Prioritising migratory bird species for assessment at proposed wind farms,
Journal of Environmental Management 90 (2009) 2672–2679
[75] Dalili, N., et al, A
review of surface engineering issues critical to wind turbine performance,
Renewable and Sustainable Energy Reviews 13 (2009) pp. 428–438
[76] Homola, M. et al, Ice
sensors for wind turbines, Cold Regions Science and Technology Journal 46
(2006) pp. 125–131
[77] van den Berg, G. Effects
of the wind profile at night on wind turbine sound, Journal of Sound and
Vibration 277 (2004) pp. 955-970
[78] The Telegraph, UK,
[on line], http://www.telegraph.co.uk/news/newstopics/howaboutthat/5364965/Wind-turbines-killed-goats-by-depriving-them-of-sleep.html, (web site consulted on May 22, 2009)
[79] Mithraratne, N. Roof-top
wind turbines for microgeneration in urban houses in New Zealand, Energy and Buildings Journal (2009) Article in
Press, 6 pp.
[80] ERCB, [on line], www.ercb.ca, (web site consulted on December 22, 2008)
[81] Canadian Nuclear Association, [on line], http://www.cna.ca, (web site consulted in December, 2007)
[82] Srebotnjak, T., The role
of environmental statisticians in environmental policy: the case of performance
measurement, Environmental Science & Policy Journal (2007) pp. 405–418
[83] Espinosa, A. et al,
A complexity approach to sustainability – Stafford Beer revisited, European Journal of Operational Research (2008) pp.
636–651
[84] Environment Canada, [on
line], http://www.ec.gc.ca/pdb/ghg/inventory_report/2006_report/ta9_10_eng.cfm, (web
site consulted in December, 2008)
[85] Ontario Ministry of Natural Resources, WIND TURBINES and BATS:
Bat Ecology Background Information and Literature Review of Impacts, December
2006, 61 p.
[86] PricewaterhouseCoopers, [on line] http://www.pwc.com, (web
site consulted in December, 2008)
[87] Government
of Alberta, Finance and Enterprise, [on line] http://www.finance.alberta.ca/calc-script/tax_calc.html, (web site consulted in February, 2009)
[88] Government
of Alberta, Finance and Enterprise, [on line] http://www.albertacanada.com/documents/SP-EH_highlightsABEconomy.pdf, (web site consulted in September, 2009)
[89] Government
of Alberta, Finance and Enterprise, [on line] http://www.gov.ab.ca/acn/200609/20516CBB2A361-DA7B-09CD-E760C8C6970EC294.html, (web site consulted in October, 2009)
[90] Government
of Alberta, Finance and Enterprise, [on line] http://www.finance.alberta.ca/publications/tax_rebates/rates/hist1.html, (web
site consulted in October, 2009)
[91] Howell-Mayhew Engineering, Inc.,
[on line] http://www.hme.ca/cv/Howell-Mayhew%20Engineering%20Solar%20PV%20Profile.pdf , (web
site consulted in December, 2009)
The list of developed stakeholders in the process of development of
this feasibility project is shown in the Table A.1.
|
Company/Agency |
Contact |
|
Energreen systems |
Josh Taschuk |
|
AeroVironment |
Lisa Mandel |
|
Wind Simplicity
Inc |
Niki Koulouris |
|
Wind
Simplicity Inc |
Sharolyn Vettese |
|
Wind
Simplicity Inc |
Alfred Mathieu |
|
Trimline |
Harold Verburg |
|
Raigatta
Energy Inc. |
Guy Spence |
|
Windmission
Co. |
Claus Nybroe |
|
Solacity Inc. |
Rob Beckers |
|
Free Breeze Energy Systems Ltd. |
John Hogg |
|
Terralta
Inc. |
Chris Brooks |
|
Howell-Mayhew Engineering |
Gordon Howell |
|
Cleanfield Energy |
Brad Davis |
|
Transportation
Canada |
Marc Turgeon |
|
Transportation Canada |
Tom Lowrey |
|
Transportation
Canada |
Eduard Alf |
|
Transportation Canada |
Kathie Keeley |
|
Navigation
Canada |
Jean Seguin |
|
Edmonton Airports Authority |
Rob Hough |
|
Transportation
Canada |
Micheline Powell |
|
Transportation Canada |
Davis Kim |
|
Transportation
Canada |
Christine Lodge |
|
Transportation Canada |
Didrik Strand |
|
City of Hamilton |
Geoff
Lupton |
|
City of
Calgary |
Michael
Kehoe |
|
City of
Edmonton |
Shannon Mickelson |
|
|
|
|
|
|
Table A.1: Stakeholders summary
The Alberta Utilities Commission (AUC) reports the
monthly increase in micro-generation application in Alberta under the new
micro-generation regulation. The report includes only those sites that have a meter
installed and with generation data starts flowing.
|
Sites with generation data flowing |
Jan |
Feb |
Mar |
April |
May |
June |
|
Micro-Generation
Sites in operation during the month: |
24 |
5 |
11 |
12 |
3 |
8 |
|
Capacity
installed (kW) during the month |
88 |
13 |
97 |
37 |
23 |
21 |
|
Accumulated
capacity installed [kW] |
88 |
101 |
198 |
235 |
258 |
279 |
|
Accumulated
site |
24 |
29 |
40 |
52 |
55 |
63 |
|
Capacity
per site [kW] |
3.7 |
3.5 |
4.9 |
4.5 |
4.7 |
4.4 |
|
Average
sites per month without January |
|
5 |
8 |
9.3 |
7.8 |
7.8 |
|
|
|
|
|
|
|
|
|
Approved sites |
Jan |
Feb |
Mar |
April |
May |
June |
|
Accumulated
MG sites as of the month end |
41 |
46 |
57 |
69 |
72 |
80 |
|
Accumulated
installed capacity (kW) as of the month end |
149 |
162 |
259 |
296 |
319 |
340 |
|
Accumulated
capacity installed [kW] |
149 |
312 |
572 |
867 |
1186 |
1526 |
|
Accumulated
site |
41 |
87 |
144 |
213 |
285 |
365 |
|
Capacity
per site [kW] |
3.6 |
3.6 |
4.0 |
4.1 |
4.2 |
4.2 |
|
Average
sites per month |
41 |
44 |
48 |
53 |
57 |
61 |
Table B.1: Micro-generation
development in Alberta up to June 2009 under the new regulation
As summary of the concern
areas which are being developed constantly are:
Wind turbine aerodynamics
Aerodynamics is a science
and study of physical laws of the behaviour of objects in airflow and the
forces that are produced by airflows. There are significant interactions with
universities, industries and foreign researchers in the area of fundamental
aerodynamics.
Wake effect
To determine how the lift
of an aerofoil actually developed it is essential to study the wake effect.
This depends of each project and on roof project has particularities to take in
consideration.
Performance and
reliability of wind turbines
The
performance of a wind turbine depends on the power coefficient, CP, which
states how much of the power in the wind that is absorbed by the wind turbine.
For a HAWT, the CP value is usually between 0.30 and 0.40; for VAWT, the efficiency
is comparable with the best modern HAWTs. Important progress in material and
aerodynamic research has been made since then, which could increase the
performance.
Gearbox
The gearbox is necessary
in wind turbines to translate the variable rotation speed to a constant
generation frequency. The gearbox generate was a source of failures and defects
in many wind turbines. In [12] is presented procedures for designing compact
spur gear sets with the objective of minimizing the gear size. Various dynamic
rating factors were investigated and evaluated.
Generator
The electrical system of
the wind turbine includes all components for converting mechanical energy into
electrical power. This system consumes energy which usually is not taken in
consideration, but it could modify the resultants in the technology evaluation.
Blade
The development of special
purpose aerofoil for HAWT began in 1984. New aerofoils have been developed to
meet the specific demands of wind turbine. This has resulted in a greater
efficiency of energy capture. Many researchers had developed different
techniques for design, testing, fatigue strength analysis of wind turbine
blades have been reviewed in the following literature.
Loads
As part of the design
process, a wind turbine must be analyzed for aerodynamic, gravitational,
inertia loads and operational loads. Researchers had developed various
mathematical models for the calculation of structural loads and material
stresses [12].
Tower
In
[31] is determined the optimum tower height using power law and by algorithmic
law. The optimum height increases as the wind shear increases for village and
suburban terrain.
Design
There are several aspects
of the methods currently used for the design calculation of the wind turbine
performance and loading. The different types of analysis and methods for the
design of wind turbine systems have been reviewed for the purpose of this
report. In high speed
winds, the blades and gearboxes of conventional turbines cannot cope with the
strain, and they have to be shut down. Some design reach to be operative with
wind speeds as high as 110 km/h.
Eurowind Developments, a British consortium, believes VAWTs could be the best design for giant offshore turbines,
so giant such as 10 MW. Today's largest horizontal-axis turbines produce around
5 MW, and are proving difficult to scale up. Each blade has to be more than 60
metres long, and the bigger the blade, the greater the stress it experiences as
it turns: the blade's own weight compresses it at the top of the cycle and
stretches it at the bottom. As a result, blades must be made and transported in
one piece, which is expensive. Reinforcing the blade to enable it to withstand
these forces further increases cost and reduces efficiency. The blades of a VAWT, in contrast, do not have to undergo this repeated
stretching and compression. Nor does their cross-section vary from top to
bottom, which makes them cheaper to manufacture than windmill blades, the shape
of which must be painstakingly engineered. VAWT blades
can also be made in pieces and joined together on site. So vertical-axis
designs should enable wind turbines to be scaled up more easily, resulting in
cheaper electricity, even for VAWT designs of similar
efficiency to conventional turbines.
Respondents
indicated that the most active current markets for SWTs are in four areas:
battery charging, on-grid residential, farms & commercial and northern
communities. Each is distinct in terms of SWT preference, decision-making
factors and geographic activity. Renewable energy is abundant and its technologies
are well established to provide complete security of energy supply. Among
renewable energy sources, wind energy plays an important role. From the late
1800s to the early 1900s, thousands of US farmers and ranchers used windmills
to pump water, grind grain, charge batteries and provide power for radios,
lights and washing machines. The use of windmills to provide electric power
died out in the early 1930s when the Rural Electrification Administration made
cheap electricity generated at centralized power stations available to farms
and ranches across the country.
Today,
many reasons are spiralling upwards and weak electrical grids make power to
remote farms and ranches less reliable than in the past. Researchers estimate
that 50% of the United States has enough wind resources for small turbine
development and 60% of US homes are located in those wind resource areas. Using
small wind turbines, farmers, ranchers and homeowners can reduce their utility
bills, stabilize their electricity supplies, increase the efficiency of the
energy use, increase the friendly energy production and contribute to the
country energy supply.
Market research indicates
that a number of opportunities exist for promotion of the small wind industry
in Alberta. There is an opportunity to develop the industry sector in the 20 kW
to 50 kW range where Alberta and Canada already have a slight competitive
advantage. A focus on developing farm markets would be of direct benefit to the
Canadian manufacturers and the development of small business [2].
Support for a SWT
manufacturing industry helps to retain investment in Alberta, promote job
creation and assist in local economic development.
As the SWT markets grow and mature, turbine prices
are expected to fall and turbine effectiveness and reliability to increase.
Drawing on U.S.
experience, it appears that a SWT promotional strategy would require incentives
in four areas: market development, policy development, technology development
and education and awareness-raising.
Many small differences
characterize both kind of turbines HAWT and VAWT; in this appendix are exposed
the most important differences.
HAWTs can have problems
with tower interference caused by the tower shadow. This problem is not as big
for upwind turbines as for downwind turbines. The tower shadow affects the
turbine dynamics, gives power fluctuations and increases noise generation [38].
VAWTs do not experience tower interference as the distance between blades and
tower is much larger.
The blade of a HAWT is
subject to a gravity-induced reversing stress at the root of the blade, which
is not the case for VAWT blades. This is believed to be the main limitation for
increasing the size for HAWTs. The blades of a HAWT are also subject to
periodical loads due to the wind shear. These loads could cause fatigue of the
blades. The blades of the H-rotor are subject to large bending moments due to
the centripetal acceleration. This effect decreases as the turbine size
increases since the centripetal acceleration decreases with increasing turbine
radius, assuming a constant blade speed [17][38].
HAWTs have relatively
constant torque. VAWTs have an inherent torque ripple. The torque ripple is
caused by the continuously changing angle of attack between the blades and the
apparent wind. The torque ripple can affect the fatigue life of the drive train
components as well as the output power quality. By increasing the number of
blades to three or more, the torque ripple is decreased substantially [41].
HAWTs are self-starting at
a low wind speed. VAWTs have poor starting torque due to the blade stall
condition at high angles of wind attack. The H-rotor has better self-starting
ability between VAWTs. For a grid connected turbine, the grid can be used to
start the turbine by using the generator as a motor and therefore the
self-starting is not a major issue. However, there are examples of
self-starting VAWTs [17].
Wind turbines that rotate about a vertical
axis, rather than the usual horizontal one, could have a number of benefits. Divers companies [40][42][43] have developed VAWT technology
with a notable increase in general performance such as low noise, rate of
rotation, efficiency (between 43-45%), etc. For HAWT technology, the
improvement is less evident, but the effort continues worldwide such as the
Canadian whale tubercle blade design [47].
The following table presents the summary
comparison between HAWT and VAWT technologies.
|
Subject |
VAWT |
HAWT |
|
Blade profile |
Simple |
Complicated |
|
Yaw mechanism |
No
need |
Need |
|
Pitch mechanism |
Yes |
Yes |
|
Tower |
Yes |
Yes |
|
Guy wires |
Optional |
No |
|
Noise |
low |
High |
|
Blade area |
moderate |
Small |
|
Generator position |
On
ground |
On
top of tower |
|
Blade load |
moderate |
High |
|
Self starting |
No |
Yes |
|
Tower interference |
Small |
Large |
|
Foundation |
moderate |
Extensive |
|
Overall structure |
Simple |
Complicated |
|
Work with turbulence |
Yes |
moderate |
|
On roof applications |
Yes |
Special
designs |
|
|
|
|
Table E.1: Comparison between HAWT
and VAWT technologies
This table presents the different
value for the EROEI index; the index shows a low value for technologies based
on biomass and solar photovoltaic. In Canada, weather and radiation
availabilities stress more this low index for these technologies.
|
Technology |
Description
|
EROEI |
|
||
|
Hydropower
|
11.2 |
|
|||
|
Wind |
Large on-shore development |
12 to 30 |
|
||
|
Small development |
10 to 18 |
|
|||
|
Geothermal
|
Hot dry rock |
1.9 to 13 |
|
||
|
Oil and gas (domestic
wellhead)
|
1940's |
>100 |
||||
|
1970's |
8
to 27 |
|||||
|
Coal (mine mouth) |
1950's |
80 |
||||
|
1970's |
50 |
|||||
|
Oil shale |
1 to 13.3 |
|||||
|
Ethanol (sugar cane) |
1 to 1.7 |
|||||
|
Ethanol (corn) |
1.3 |
|||||
|
Ethanol (corn residues) |
1 to 1.8 |
|||||
|
Methanol (wood) |
2.6 |
|||||
|
Solar
|
Power satellite |
2 |
|
||
|
Power tower |
4.2 |
|
|||
|
Photovoltaic large development |
4 to 10 |
|
|||
|
Photovoltaic small development |
1.7 to 5 |
|
|||
|
Solar space heat (fossil
backup)
|
Flat-plate collector |
1.9 |
||||
|
Concentrating collector |
1.6 |
|||||
|
|
|||||
Table F.1: EROEI
index for different technologies
|
ID |
Model |
Builder |
Type |
Sub-type |
Power [kW] |
|
OE-1 |
BWC Excel |
Bergey WindPower |
HAWT |
3 blades |
10 |
|
OE-2 |
Enercon 12 |
Enercon |
HAWT |
3 blades |
30 |
|
OE-3 |
PG 20/25 |
Energy PGE |
HAWT |
3 blades |
25 |
|
OE-4 |
PG 20/35 |
Energy PGE |
HAWT |
3 blades |
35 |
|
OE-5 |
Scirocco ES |
EotTec |
HAWT |
2 blades |
6 |
|
OE-6 |
Vergnet GEV |
Vergnet |
HAWT |
2 blades |
20 |
|
OE-7 |
WES 5 Tulipo |
Wind Energy Solution
Canada |
HAWT |
2 blades |
2.5 |
|
OE-8 |
V 3.5 |
Cleanfield Energy |
VAWT |
H-Rotor |
3.5 |
|
OE-9 |
3 |
Wind Simplicity |
HAWT |
8 blades |
3 |
|
OE-10 |
7 |
Wind Simplicity |
HAWT |
8 blades |
7 |
|
OE-11 |
23 |
Wind Simplicity |
HAWT |
8 blades |
23 |
|
OE-12 |
AJT-30 |
Aero Joule |
HAWT |
42 blades |
3 |
|
OE-13 |
AJT-45 |
Aero Joule |
HAWT |
48 blades |
4.5 |
|
OE-14 |
AJT-100 |
Aero Joule |
HAWT |
48 blades |
10 |
|
OE-15 |
AJT-200 |
Aero Joule |
HAWT |
54 blades |
20 |
|
OE-16 |
ERD 1 |
Énergie Ressource Développement |
VAWT |
L-shaped |
5 |
|
OE-17 |
ERD 4 |
Énergie Ressource Développement |
VAWT |
L-shaped |
1.5 |
|
OE-18 |
ERD 5 |
Énergie Ressource Développement |
VAWT |
L-shaped |
|
|
OE-19 |
WS-75W |
Windside |
VAWT |
Helical |
7.5 |
|
OE-20 |
WS-30W |
Windside |
VAWT |
Helical |
3 |
|
OE-21 |
WS-4W |
Windside |
VAWT |
Helical |
0.4 |
|
OE-22 |
6 |
Eoltec |
HAWT |
2 blades |
6 |
|
OE-23 |
25 |
Eoltec |
HAWT |
2 blades |
25 |
|
OE-24 |
AR-1000 |
Vaigunth |
HAWT |
3 blades |
1 |
|
OE-25 |
AR-5000 |
Vaigunth |
HAWT |
3 blades |
5 |
|
OE-26 |
AT5-1 |
Iskrawind |
|
|
5 |
|
OE-27 |
Whisper 500 |
Southwest Windpower |
HAWT |
2 blades |
3 |
|
OE-28 |
Model 31-20 |
Jacobs Wind Systems |
HAWT |
3 blades |
20 |
|
OE-29 |
ARE110 |
Abundant Renewable
Energy |
HAWT |
3 blades |
2.5 |
|
OE-30 |
are442 |
Abundant Renewable
Energy |
HAWT |
3 blades |
10 |
|
OE-31 |
S322 |
Helix Wind |
VAWT |
Helical |
2.5 |
|
OE-32 |
s595 |
Helix Wind |
VAWT |
Helical |
5 |
|
OE-33 |
AVX1000 |
Aero Environment |
HAWT |
5 blades |
1 |
|
OE-34 |
1Kw |
Neuhäuser |
VAWT |
H-Rotor |
1 |
|
OE-35 |
10kW |
Neuhäuser |
VAWT |
H-Rotor |
10 |
Table G.1: Summary of the studied
turbines
The sources of aerodynamic noise can be divided
into low-frequency noise, inflow turbulence noise, and airfoil self-noise. Low-frequency
noise is caused by the aerodynamic interaction between the tower and the
blades, and is considered to be of little importance for turbines with an
upwind configuration (i.e. with the rotor upstream of the tower).
Inflow-turbulence noise is caused by the interaction of upstream atmospheric
turbulence with the leading edge of the blade, and depends on the atmospheric
conditions. Airfoil self-noise is the noise produced by the blade in an
undisturbed inflow, and is caused by the interaction between the turbulent
boundary layer and the trailing edge of the blade. Self-noise can be tonal or
broadband in character, and may be caused by several mechanisms, such as
turbulent-boundary-layer-trailing-edge noise
(subsequently denoted as trailing edge noise), trailing edge bluntness
noise, or blade tip noise. Both inflow turbulence noise and airfoil self-noise
can contribute to the overall sound level of a wind turbine, but the relative
importance of the different mechanisms is not clear yet, and may depend on the
specifications of the turbine.
|
Sound Source |
dBA |
Response
Criteria |
|
Limit
of amplified speech |
130 |
Painfully
loud |
|
Jet
takeoff (200 feet) |
120 |
Threshold
of feeling and pain |
|
Shout (0.5 feet) |
100 |
Very
annoying |
|
Heavy
truck / Pneumatic drill (50 feet) |
90 |
Hearing
damage (8 hour exposure) |
|
Passenger
train / Helicopter (500 feet) |
80 |
Annoying |
|
Freeway
traffic |
70 |
Intrusive |
|
Air
conditioning unit (20 feet) |
60 |
|
|
Normal
speech (15 feet) |
50 |
Quiet |
|
Soft
whisper (15 feet) |
30 |
Very
quiet |
|
Broadcasting
studio |
20 |
|
|
|
10 |
Just
audible |
|
|
0 |
Threshold
of hearing |
Table
H.1: Common Noise Production Levels
The following figures show
the buildings location in real proportion size in downtown Edmonton.
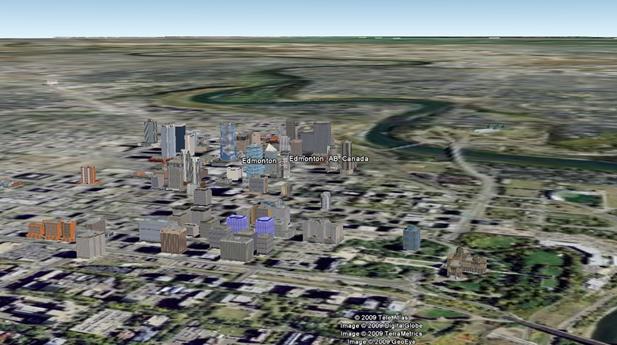
Figure
I.1: Downtown Edmonton
The
following four figures show four different points of view:
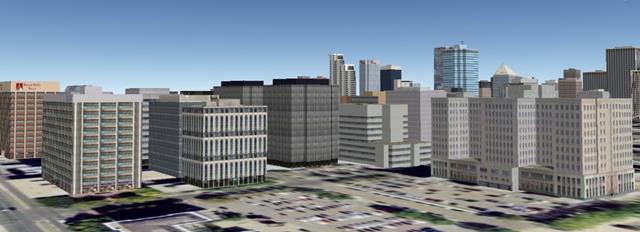
Figure I.2: NPP and SPP buildings south east view
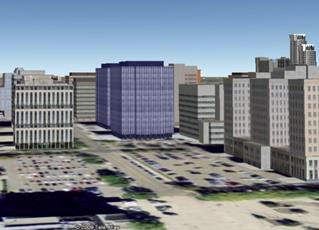
Figure I.3: NPP and SPP
buildings south view
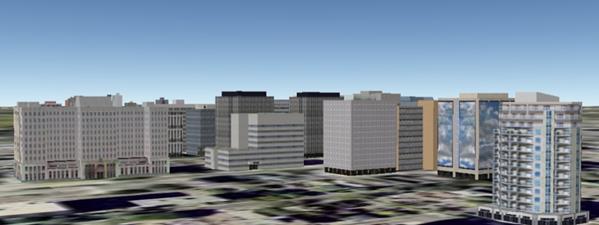
Figure I.4: NPP and SPP
buildings south
west view
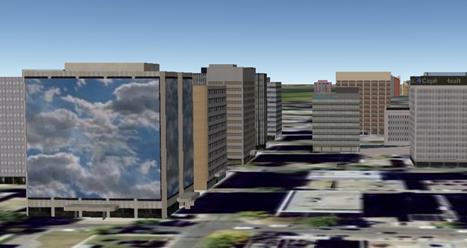
Figure I.5: NPP and SPP
buildings west
view
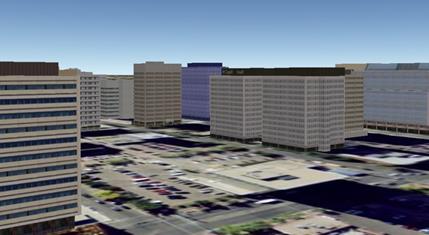
Figure I.6: NPP and SPP
buildings north-west
view
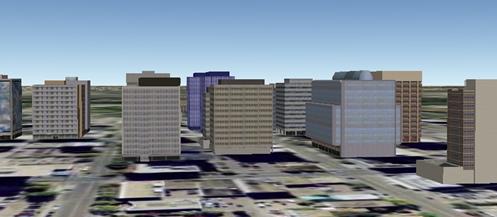
Figure I.7: NPP and SPP
buildings north
view
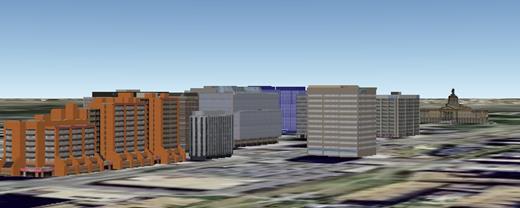
Figure I.8: NPP and SPP
buildings north
east view
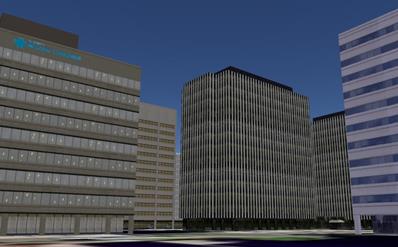
Figure I.9: NPP ground view
The technical
specifications for the minimum and maximum tallness of the turbines over the
buildings will be given by the possibility of appreciation without difficulty
the turbines and their movement for a radius of 2,000 meters. This will allow
appreciating the turbines in downtown area and both sides of Saskatchewan River
near to downtown.
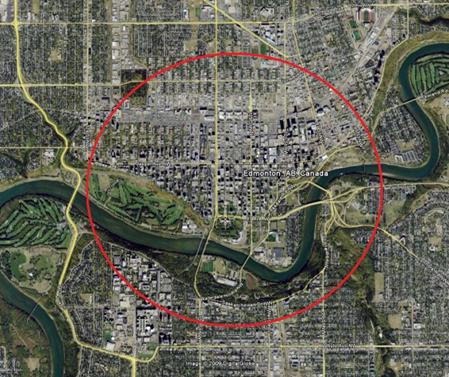
Figure I.10: area viewshed for
the turbines
In a picture observation, the human
visualization aptitude is characterized by the colour and the brightness of
each dot. The focus on a very small part of the picture at any one time; the
field of view is quite limited [59][65][66][67][68] [69][70]. The peak
processing rate of visual input information for human brain is about 5,000 bits
per second. Anything smaller than this, it is too small for the average person
to see it. The instantaneous field of view is around 2 degrees on a side. Thus
the little square picture that a person can see at any given moment contains
about 2,500 picture elements, corresponding to the wirephoto dots. Therefore,
the human eye can resolve about 0.04 degrees. The movement of the object
require at least twice the minimum human eye resolution; thus, the minimum size
should be 1.4 meters.
![]()
![]()
![]() 2,000 m
2,000 m
Figure I.11: The hub height under the turbine is
negligible this specification.
The maximum size specification is
most subjective for the visual impact specification. It is related to the
feeling of huge and potentially dangerous structure; a relationship around 25%
of the building height appears to be a reasonable specification. Thus, with a
NPP height of 50 meters, the maximum height of the turbine specification is
around 12.5 meters. The hub height under the turbine must be specified by
performance conditions. Other constraints for the height specification which is
described better later is the regulatory specification for Transportation
Canada, it specify an limit of around 60 meters above sea level. As conclusion,
10 meters is the maximum height over the building.
For showing visual impact near to
NPP building, if we suppose:
-
1.4 meters as the minimum turbine height above the building (without
hub)
-
10 meters as the maximum complete turbine height above the building
-
turbine swept area of 78.5 m2 (5 meter of radio for a HAWT)
-
as maximum, hub installed at 7 m of the building edge
![]()
![]()
![]() d
d
Figure I.12: Minimum distance to
perceive the turbine
the minimum d distance to perceive
the turbine is between 15 and 20 metres.
In this example, both
specifications produce a visual of the wind turbine between 15 and 3,000 metres
of NPP and SPP building without problems for the average person.
Two main types of atmospheric ice accumulation are
traditionally defined, in-cloud icing and precipitation icing. Icing can be
detected either directly or indirectly. The direct methods detect some property
change caused by the accretion of ice. These include mass, reflective
properties, electrical or thermal conductivity, dielectric coefficient and
inductance. The indirect methods are based upon detecting the weather
conditions that lead to icing, such as humidity and temperature, or detecting
the effects of icing, such as a reduction in power production. More than 25
methods were developed to detect icing in wind turbines.
Ice thrown from rotating blades
poses a serious safety issue, particularly when the wind power plant site
borders public sites, buildings, housing, power lines, roads and shipping
routes. Ice throw has been studied using both theoretical models and collected
experimental data. These studies have prompted a recommendation that for sites
with a high probability of icing, the distance between the turbine and the
nearest object should adhere to the following equation—with the effect of
slopes taken into account for mountainous sites:
d = 1.5 * ( D + H )
where d is the projected
distance ice can be thrown, D is the diameter of the rotor and H is the height
of the nacelle. This equation should be considered a rough estimate, but it
provides a general idea of the area at risk.
In recent years, extensive research has been
undertaken to identify and model ice prevention methods. Most of these methods
are taken from the aviation industry and can be classified in two categories:
active and passive. Passive methods rely on the physical properties of the
blade to prevent ice accumulation while active methods rely on an external
system applied to the blade. Active methods includes electrical (direct and
indirect resistance heating, microwave, etc), thermal, chemical and pneumatic
techniques. Methods of deicing the blades have been shown to
work effectively.
Two types of systems can be employed to prevent
icing—specifically de-icing and antiicing. The former removes the ice from the
surface after its formation, while the latter prevents the initiation of icing.
These systems can be either passive or active.
The disadvantages using heating methods are:
- Leading edge heating
elements will not help de-icing when active stall-controlled turbines are at a
standstill (e.g. during icing conditions combined with low-wind speeds).
- Positioning the heating
elements at the leading edge can also cause potential structural issues with
the blades.
- The electrical heating
elements can attract lightning strikes at an exposed site.
- The airfoil contour must
be kept free from waviness to avoid unnecessary disturbances of the laminar
flow around the leading edge during ice-free conditions.
- For blade cavity forced
warm air thermal systems, the efficiency of the system wanes as turbine blades
increase in size; shell structures become thicker and thermal resistance rises.
- Should one blade heater
fail, a significant mass imbalance may be imposed on the rotor as each blade
may have different icing loads.
- In some cases, the
run-back water on the blade during icing and blade heating can freeze after it
passes the heated area.
- Current anti-icing
technology consumes electricity. The break-even cost of such a heating system
depends on how much energy production is lost due to icing and the price of
electricity. Current claims suggest that the power requirement ranges between 6
and 12% of the output for smaller commercial scale turbines.
Another source of turbulence is the wind
interaction with diver obstacles, such as buildings, trees, cars, etc. the
effect of the turbulence decrease the time life of the turbines, and add a risk
factor in the blade design for the support of charges. The turbulence is
related with lose of efficiency in the wind turbine and require a hard work for
the generator face to constant rotation speed variation of the turbine. The
following figures illustrate these effects.
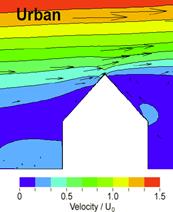
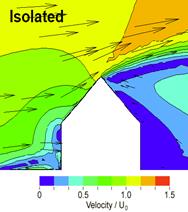
Figure
K.1: Wind-obstacle interaction for the turbulence formation and wind speed
variation
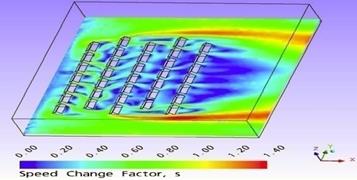
Figure
K.2: Neighbourliness consideration in the wind profile modification
In [37] is shown the difficulties associate to
on-roof wind project and turbulence, wind gust for building cooperation, etc.
This report provides an interesting source of experience, advice and studies in
the wind profile modification for building interaction.
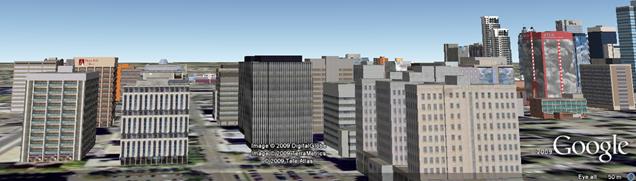
Figure K.3: NPP and SPP show a
relatively clean wind interaction with the neighbourhood buildings.
Wind condition in an area is considered in a
statistic analysis, and it is shown through the probability density function;
in [25] is shown the study of seasonal variations of the wind characteristics
and wind turbine characteristics in several regions. In [27] is shown a
statistical forecasting system for the short-term prediction of the wind energy
production.
Thousands of projects
are developed every day based on micro wind turbines around the world.
Nowadays, wind turbine projects in down-town buildings are being very common;
several projects have been proposed. Local weather conditions, regulations and
support for technology in development lead the used technology. In Canada,
yearly are installed between 600 and 700 SWT and we have between 2,000 and
2,500 SWT generating electricity today [2]. The following figures show projects
around the world:
|
|
|
|
|
|
9 kW HAWT – Londres, UK |
20 kW VAWT – UK |
40 kW VAWT – Munich, Germany |
|
|
|
|
|
|
|
3.5 kW VAWT –
Virginia - USA |
3.5 kW VAWT –
Hamilton, Canada |
3.5 kW VAWT –
Ireland |
|
|
|
|
|
|
|
4.5 kW HAWT –
Argentina |
3 1kW HAWT -
USA |
VAWT – Canada |
|
|
|
|
|
|
|
9 kW HAWT –
London, UK |
18 1 kW HAWT - USA |
1.5 kW VAWT – Hong Kong |
|
|
|
|
||
|
5 x 3.5 kW VAWT – Kenora, ON |
4 kW VAWT – Grande Prairie, AB |
||
|
|
|
|
|
|
2 x 3.5 kW
VAWT – Mohawk College, ON |
3.5 kW VAWT – Edmonton, AB |
6 kW HAWT – Germany |
|
Figure L.1: Examples
of on-roof turbines around the world
The largest and more modern PV power plant based on
solar photovoltaic technology completed in Spain (Parque Fotovoltaico Olmedilla de Alarcon), in September 2008, with a 60
MW DC peak power. The world wide capacity installed is around 3 GWp with an
average capacity factor of around 19%, which means around 5 TW[1].
Certainly, Spain solar radiation conditions do not apply in Alberta, where we
receive between 3 and 8 times less solar radiation than this site in Spain.
The PV technology has
been developed for the last 30 years. According to National Renewable Energy
Laboratory (NREL), the technology will continue evolving.
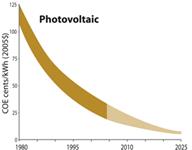
Figure M.1: PV cost evolution
Researchers are
working in other kind of technology to catch the solar radiation. Next solar
technologies generation appears to be less expensive as well as more efficient.
Technologies such as Antennas, Nano-technology and Solar Dish appear to be
found the way to evolve in that direction.
This higher cost of solar panel is demonstrated in
several jurisdictions through the subsidy that each technology receives to
promote their use. Therefore Ontario Power Authority (OPA) subsidizes for micro-generation
range solar panel with 42 cents/kWh [23] and wind technology with 11.04
cents/kWh [24]. On March 12, 2009, OPA published the intention to encourage the
development of RE through feed-on tariff scheme. OPA proposed a tariff of 80.2
cents/kWh for rooftop Solar PV below 10 kW (71.3 cents/kWh between 10 and 100
kW). For wind, OPA proposed 14.4 cents/kWh.
The analysis
presented in the following figure was developed by the Canadian Energy Research
Institute (CERI). It shows the cost of electricity generation by technology in
Canada. Solar PV has a range between 15 and 80 cents/kWh; wind has a range
between 8.5 and 10.5 cents/kWh.
Figure M.2: Cost of the electricity by technology in Canada
The use of PV
technology in AB is related with three different lines:
·
The use due to specific constraints where other technology
is not possible to apply. Most use for the industry;
·
The use in housing, more related with individual
initiatives; and
·
Showcases, led by government agencies or companies (Climate
Change Central is leading the showcases in communities [55] in Alberta).
The following table summarizes both technologies in
Alberta, Canada and the world [2][54].
|
|
|
Alberta |
Canada |
World |
|
Installed Capacity [MW] |
PV |
negligible
1 |
~0.31 |
3,000 |
|
Wind |
540 |
2,370 |
121,000 |
|
|
Generation [GWh/y] |
PV |
negligible
1 |
0.038 |
5,000 |
|
Wind |
1,561 |
6,810 |
360,000 |
|
|
Largest Power Plant [MW] |
PV |
negligible
1 |
0.11 2 |
60 3 |
|
Wind |
81.4
4 |
189
5 |
735
6 |
|
|
Efficiency [%] |
PV |
12 7 |
14 |
19 |
|
Wind |
32.9 |
32.8 |
34 |
Table M.1: Wind and PV
technology development in Alberta, Canada and the World
1 0.0134 MW appear to be the
largest PV project in AB. Climate Change Central [55]
developed showcase in central-south Alberta based on up to 2 kW solar panels
2 In Canada, does not exist Solar
Photovoltaic Plants. The largest installation is a building on-roof Federal
Government building project, 0.108 MW, in Charlottetown, PEI. (First Light
project, 19 MW, is located in Ontario. Construction is anticipated to be
completed by the end of 2009)
3 Parque
Fotovoltaico Olmedilla de Alarcon, Spain
4 Taber Wind Farm
5 Prince Wind Farm, ON
6 Horse
Hollow, Texas, USA
7 Climate
Change Central –Alberta Solar Municipal Showcase [55]
The following table shows
the ratio between Wind and PV technology:
|
|
Alberta |
Canada |
World |
|
Ratio Wind/PV Installed Capacity |
>
6,000 |
77 |
40 |
|
Ratio Wind/PV Generation [GWh/y] |
>
6,000 |
179 |
72 |
|
Ratio Wind/PV Largest Power Plant [MW] |
~
6,000 |
1890 |
12 |
|
Ratio Wind/PV Efficiency [%] |
2.7 |
2.3 |
1.8 |
Table M.2: Summary of wind and PV technology
development in Alberta, Canada and the World
It shows how Wind technology advantages PV
technology instead of lower years of development. In Canada and Alberta this
advantage is significantly higher than the rest of the world; the reason is
simple: the availability of “fuel source” as well as the weather condition and
the state of the technology. As summary, Canada is the 11th world
wide country in wind installed capacity, but is not between the 30 first
countries in solar photovoltaic. Canadian latitude helps to
understand the reason.
The visual impact is a subjective concept, some
concepts could appears pleasant for the sight, other not at all.
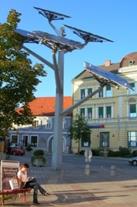
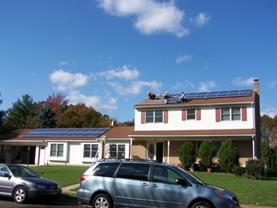
Figure M.3: Visual impact of PV technology
There is not a public concern about the visual impact
of PV technology: the bigger PV power plants are in deserts and there is not a
massive use of PV in cities.
Also, for small applications, the beauty or not of a
PV application stay confine at the place where it is developed without a big
community impact.
The largest and more
modern power plant based on solar photovoltaic technology completed in Spain,
in September 2008, with a 60 MW DC peak power. This plant produces 85 GWh/y
which represent 16% of capacity factor.
In Canada and Alberta, the
efficiency of the current technology is between 9 and 12% [55], one of the
lower efficiency in available renewable technologies. The following figures
help to understand why in other jurisdiction this technology has more
possibilities. The difference between these other jurisdictions and Alberta are
huge, they receive between 3 and 8 more solar radiation than we receive in AB.
Medias and opportunist businessmen do believe that in Alberta and Canada we can
develop under same conditions the PV technology.
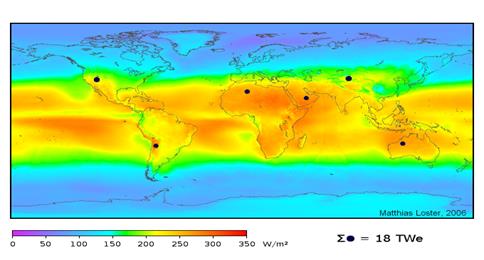
Figure M.4: Solar radiation distribution around the
world
World solar radiation; it is shown the feeble
condition to apply this technology in Canada
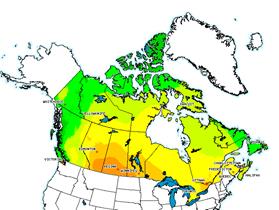
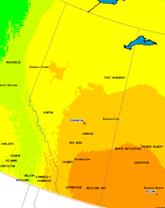
Figure M.5: Canada and Alberta solar radiation
distribution
In addition, in Canada, PV
technology is more inefficient when more energy is necessary, during winter,
stressing its inefficiency.
In the south of the
United Stated a solar panel should work for three year to recover the energy
invested in its production. In Alberta/Canada this period rises up to 6 years.
Other technologies, such as wind or coal power plants, need to work for between
6 and 12 month to recover the energy invested.
The index is added in
the following table. PV has an EROEI between 1.7 and 5 in USA; in
Alberta/Canada has an EROEI between 0.9 and 2.5. Wind technology has an EROEI
between 10 and 18. Appendix F presents the EROEI for different technologies.
The following table
shows the estimation in rate of job creation for some technologies [56] for big
scale applications; for micro-generation the factor of increase is between 10
and 15.
|
Renewable energy |
Construction & installation Ratio per [MWp] |
Operation & maintenance ratio per [MWp] |
|
Wind
|
1.5 |
0.3 |
|
Solar—
Photovoltaic |
5.9 |
3.0 |
Table M.3: Summary of job creation rations for wind
and PV technologies
It shows the
potential of both technologies as job creators as well as the relationship with
cost maintenance between them.
PV consumes no fuel for continuing operation, and has
no emissions directly related to electricity production. Operation does not
produce carbon dioxide, sulfur dioxide, mercury, particulates, or any other
type of air pollution, as fossil fuel power sources do. PV panel consume
resources in manufacturing and construction. During manufacture of the panel,
steel, concrete, aluminum and other materials will have to be made and
transported using energy-intensive processes, generally using fossil energy
sources. The initial carbon dioxide emissions "pay back" is claimed
by one company to be within about 3 years of operation.
In addition, studies [57] show the noxious effect
in the atmospheric contamination on PV cells in concentrating systems. However,
cell panels manufacturing involve the release of Nitrogen Trifluoride (NF3) to
the atmosphere. This gas is not taking in consideration in the analysis of GHG
emission by the different technologies instead of to be 17,000 times for
powerful than CO2 as GHG.
The following table
presents the estimation in GHG emission for each technology
|
Technology |
g/kWh |
|
Photovoltaic |
40 – 120 |
|
Solar
Thermal |
30 – 100 |
|
Wind |
20 – 55 |
Table M.4: GHG emission for different technologies in
Alberta according to RETScreen software
RETScreen V.4 software, by NRCan, takes around 40 g/kWh of
GHG emission for technologies, wind and PV.
Solar photovoltaic
presents few characteristics in the promotion of micro-generation technologies
and renewable sources of energy. The community effect is huge at the start of
the project, but then become part of the down-town scenario or landscape and
this effect is reduced quickly in the time. An example of that is the solar
panel installed on-roof of the legislature building. It required a huge
investment, it continues working, but few people know that it exists and it
doesn’t contribute in micro-generation or renewable source of energy promotion.
Figure M.6 shows a 13
kW building-integrated grid-dependent PV system on the roof of EPCOR's
23-storey headquarters, Edmonton (1996-2001) [91]. Figure M.7 shows the PV
system installed in the Alberta Legislature in 2003. These figures show the
failure of PV technology in the promotion of micro-generation as well as
expensive and inefficient projects.
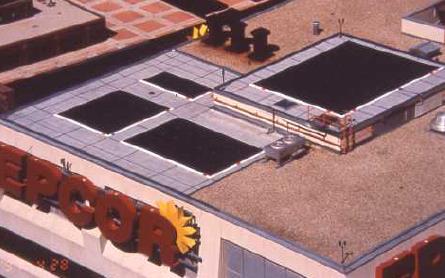
Figure M.6: EPCOR
headquarters PV installation [91]
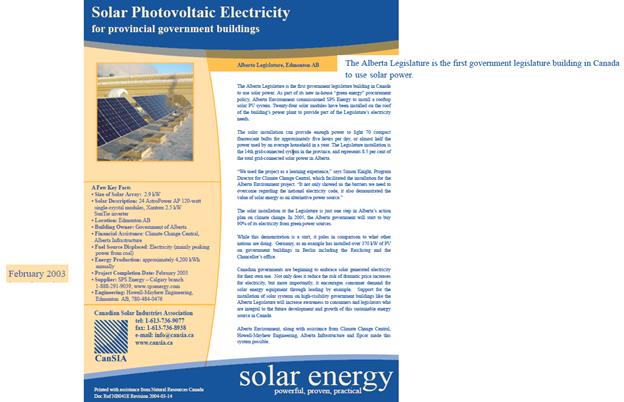
Figure M.7: PV project in
the Alberta Legislature
|
|
Stand-by |
||
|
Subject |
Impact |
Probability |
Risk |
|
Cost variation |
None |
Low |
0 |
|
Inefficiency
perception |
None |
Low |
0 |
|
Bad technology
perception (costly, noise, bird, icing, etc) |
None |
Low |
0 |
|
Environment non
care |
Medium |
Medium |
-4 |
|
MG promotion
failure |
Low |
Medium |
-2 |
|
Weather database
failure |
None |
Low |
0 |
|
Regulations |
None |
Low |
0 |
|
|
Solar Panel |
||
|
Subject |
Impact |
Probability |
Risk |
|
Cost variation |
Low |
Medium |
-2 |
|
Inefficiency
perception |
High |
Medium |
-6 |
|
Bad technology
perception (costly, noise, bird, icing, etc) |
High |
Medium |
-6 |
|
Environment non
care |
High |
Medium |
-6 |
|
MG promotion
failure |
High |
Low |
-3 |
|
Weather database
failure |
Medium |
Low |
-2 |
|
Regulations |
Low |
Low |
-1 |
|
|
Wind VAWT |
||
|
Subject |
Impact |
Probability |
Risk |
|
Cost variation |
Low |
Medium |
-2 |
|
Inefficiency
perception |
High |
Low |
-3 |
|
Bad technology
perception (costly, noise, bird, icing, etc) |
High |
Low |
-3 |
|
Environment non
care |
High |
Low |
-3 |
|
MG promotion
failure |
High |
Low |
-3 |
|
Weather database
failure |
High |
Low |
-3 |
|
Regulations |
Low |
Low |
-1 |
|
|
Wind Ground |
||
|
Subject |
Impact |
Probability |
Risk |
|
Cost variation |
Low |
Medium |
-2 |
|
Inefficiency
perception |
High |
Low |
-3 |
|
Bad technology
perception (costly, noise, bird, icing, etc) |
High |
Low |
-3 |
|
Environment non
care |
High |
Low |
-3 |
|
MG promotion
failure |
High |
Low |
-3 |
|
Weather database
failure |
High |
Low |
-3 |
|
Regulations |
Low |
Low |
-1 |
Table N.1: Risk analysis details for the four
alternatives
The
following figures shows the business cases for Wind on-roof wind turbine and
solar panels alternatives
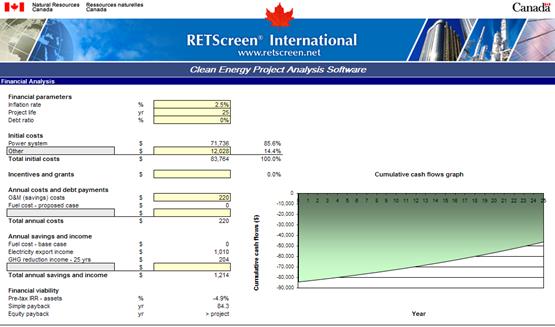
Figure O.1: Financial Analysis - Solar Panel
project
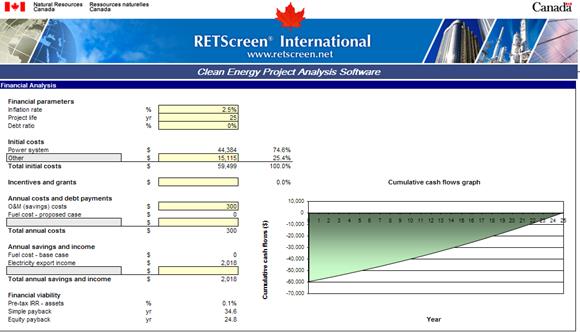
Figure O.2: Financial Analysis – Wind Project
The comparison considering ROR = 0%, non GoA Manpower,
13c$/kWh and 20 year project:
|
PV values |
DoE |
Eng |
Com |
Part |
|
Maintenance |
(26,629) |
(26,629) |
(13,315) |
(8,322) |
|
Capital Expenditure |
(89,424) |
(139,424) |
(89,424) |
(7,310) |
|
Energy saving |
82,114 |
82,114 |
82,114 |
0 |
|
Project PV |
(33,940) |
(83,939) |
(20,625) |
(15,632) |
Table P.1: On-roof wind
project, business case 1
The comparison considering ROR = 9%, non GoA Manpower,
13c$/kWh and 20 year project:
|
PV values |
DoE |
Eng |
Com |
Part |
|
Maintenance |
(10,350) |
(10,350) |
(5,175) |
(3,234) |
|
Capital Expenditure |
(89,424) |
(139,424) |
(89,424) |
(51,070) |
|
Energy saving |
38,354 |
38,354 |
38,354 |
0 |
|
Project PV |
(61,420) |
(111,420) |
(56,245) |
(54,304) |
Table P.2: On-roof
wind project, business case 2
The comparison considering ROR =
9%, considering GoA Manpower, 13c$/kWh and 20 year project:
|
PV values |
DoE |
Eng |
Com |
Part |
|
Maintenance |
(10,350) |
(10,350) |
(5,175) |
(3,234) |
|
Capital Expenditure |
(89,424) |
(139,424) |
(89,424) |
(51,070) |
|
GoA Manpower |
(72,500) |
(42,500) |
(34,167) |
(34,167) |
|
Energy saving |
38,354 |
38,354 |
38,354 |
0 |
|
Project PV |
(133,920) |
(153,920) |
(90,412) |
(88,471) |
Table P.3: On-roof
wind project, business case 3
|
|
DoE |
||
|
Subject |
Impact |
Probability |
Risk |
|
Errors in the
specifications |
Medium |
Medium |
-4 |
|
Cost variation |
Medium |
Low |
-2 |
|
Delay in the project |
Medium |
Medium |
-4 |
|
Efficiency
deterioration |
Medium |
Medium |
-4 |
|
Warranty
|
None |
None |
0 |
|
Changes
in Law |
Medium |
None |
0 |
|
Site
Conditions |
Medium |
Low |
-2 |
|
Project
Revenue |
Low |
Low |
-1 |
|
Cost |
Low |
Medium |
-2 |
|
Limitation
of Liability |
Low |
Low |
-1 |
|
Termination
Rights |
Low |
Low |
-1 |
|
Environmental
Impact |
Low |
Low |
-1 |
|
Design
|
High |
Medium |
-6 |
|
Real
Property Value |
Medium |
Low |
-2 |
|
Operations
|
Medium |
Medium |
-4 |
|
Acts
of God |
Low |
Low |
-1 |
|
Performance
|
Medium |
Medium |
-4 |
|
Authorities
and Permits |
Low |
Low |
-1 |
|
Insurance
|
Low |
Low |
-1 |
|
Design
Control |
Medium |
Low |
-2 |
|
|
Eng |
||
|
Subject |
Impact |
Probability |
Risk |
|
Errors in the
specifications |
Medium |
Low |
-2 |
|
Cost variation |
Medium |
Low |
-2 |
|
Delay in the
project |
Medium |
Medium |
-4 |
|
Efficiency
deterioration |
Medium |
Medium |
-4 |
|
Warranty
|
None |
None |
0 |
|
Changes
in Law |
Medium |
None |
0 |
|
Site
Conditions |
Low |
Low |
-1 |
|
Project
Revenue |
Medium |
Low |
-2 |
|
Cost |
Medium |
Medium |
-4 |
|
Limitation
of Liability |
Low |
Low |
-1 |
|
Termination
Rights |
Low |
Low |
-1 |
|
Environmental
Impact |
Low |
Low |
-1 |
|
Design
|
Medium |
Low |
-2 |
|
Real
Property Value |
Medium |
Low |
-2 |
|
Operations
|
Medium |
Low |
-2 |
|
Acts
of God |
Low |
Low |
-1 |
|
Performance
|
Medium |
Medium |
-4 |
|
Authorities
and Permits |
Low |
Low |
-1 |
|
Insurance
|
Low |
Low |
-1 |
|
Design
Control |
Medium |
Low |
-2 |
|
|
Com |
||
|
Subject |
Impact |
Probability |
Risk |
|
Errors in the
specifications |
Low |
Low |
-1 |
|
Cost variation |
Low |
Low |
-1 |
|
Delay in the
project |
Medium |
Low |
-2 |
|
Efficiency
deterioration |
Medium |
Medium |
-4 |
|
Warranty
|
None |
None |
0 |
|
Changes
in Law |
Medium |
None |
0 |
|
Site
Conditions |
Low |
Low |
-1 |
|
Project
Revenue |
Medium |
Low |
-2 |
|
Cost |
Medium |
Low |
-2 |
|
Limitation
of Liability |
Low |
Low |
-1 |
|
Termination
Rights |
Low |
Low |
-1 |
|
Environmental
Impact |
Low |
Low |
-1 |
|
Design
|
Low |
Low |
-1 |
|
Real
Property Value |
Low |
Low |
-1 |
|
Operations
|
Medium |
Low |
-2 |
|
Acts
of God |
Low |
Low |
-1 |
|
Performance
|
Medium |
Low |
-2 |
|
Authorities
and Permits |
Low |
Low |
-1 |
|
Insurance
|
Low |
Low |
-1 |
|
Design
Control |
Low |
Low |
-1 |
|
|
Part |
||
|
Subject |
Impact |
Probability |
Risk |
|
Errors in the
specifications |
Low |
Low |
-1 |
|
Cost variation |
Low |
Low |
-1 |
|
Delay in the
project |
Medium |
Low |
-2 |
|
Efficiency deterioration |
Low |
Low |
-1 |
|
Warranty
|
None |
None |
0 |
|
Changes
in Law |
Medium |
None |
0 |
|
Site
Conditions |
Low |
Low |
-1 |
|
Project
Revenue |
Low |
None |
0 |
|
Cost |
Low |
Low |
-1 |
|
Limitation
of Liability |
Low |
Low |
-1 |
|
Termination
Rights |
Low |
Low |
-1 |
|
Environmental
Impact |
Low |
Low |
-1 |
|
Design
|
Low |
Low |
-1 |
|
Real
Property Value |
Low |
Low |
-1 |
|
Operations
|
Low |
Low |
-1 |
|
Acts
of God |
Low |
Low |
-1 |
|
Performance
|
Low |
Low |
-1 |
|
Authorities
and Permits |
Low |
Low |
-1 |
|
Insurance
|
Low |
Low |
-1 |
|
Design
Control |
Low |
Low |
-1 |
Table Q.1: Risk analysis details for the four
in-roof wind alternatives
The initial and fixed
cost estimation are:
|
|
Initial cost [$] |
GoA Manpower [$] |
Turbine
cost [$] |
Maintenance
[$/y] |
Decommissioning
[$] |
|
DoE |
0 |
72,500 |
96,667 |
800 |
15,000 |
|
Eng |
75,000 |
42,500 |
96,667 |
800 |
15,000 |
|
Com |
0 |
34,167 |
96,667 |
400 |
15,000 |
|
Part |
0 |
34,167 |
96,667 |
250 |
15,000 |
Table R.1: Wind project cost estimations
Initial cost includes
the cost of contract an engineering company for the development of the project.
GoA manpower includes the cost of GoA personnel in the development of the
project including administrative costs. It does not include cost associated with
work hours spent out of the development of the project such as commission meetings.
Decommissioning is the estimated cost of decommissioning at the end of the
project.
The saved money in
electricity generation is 2,523 $/y the first year; the present value for the
life time of the project is:
|
Year |
0 |
1 |
2 |
3 |
4 |
5 |
6 |
…. |
25 |
|
Energy saving [$] |
|
2,523 |
2,581 |
2,640 |
2,701 |
2,763 |
2,827 |
…. |
4,354 |
|
Present value [$] |
|
2,523 |
2,368 |
2,222 |
2,086 |
1,957 |
1,837 |
…. |
550 |
|
Add of PV [$] |
32,640 |
|
|
|
|
|
|
|
|
Table R.2: Energy and money saved over the time
And the recovery
money through taxes:
|
Year |
0 |
1 |
2 |
3 |
4 |
5 |
6 |
…. |
25 |
|
Income
Tax [$] |
|
5,741 |
3,771 |
3,857 |
3,946 |
4,037 |
4,130 |
…. |
6,362 |
|
Provincial
Personal Income Tax [$] |
|
3,298 |
4,328 |
5,359 |
6,389 |
7,420 |
8,450 |
…. |
28,028 |
|
Total
Tax [$] |
|
9,039 |
8,099 |
9,216 |
10,335 |
11,456 |
12,580 |
…. |
34,390 |
|
PV
Tax Recovery [$] |
|
9,039 |
7,430 |
7,757 |
7,981 |
8,116 |
8,176 |
…. |
4,347 |
|
Add of PV taxes [$] |
171,452 |
|
|
|
|
|
|
|
|
Table R.3: Money recovered over the time
Income Tax recovery
is based on the average of company tax recovery by the GoA. The estimation is
very complex; companies in Canada are subject to 49 different taxes and other
18 payments to the governments at federal, provincial and municipal level [86]
[88] [89] [90]. The calculus includes the estimation of growth in the
micro-generation businesses based on the current and forecasted trend.
The Personal Income
Tax recovery is based on the average recovery for an average family in Alberta.
Finance and Enterprise minister provide this information as well as a
calculator for any estimation [87]. And each case:
|
DoE |
|
|
|
|
|
|
|
|
|
Year |
0 |
1 |
2 |
3 |
4 |
5 |
…. |
25 |
|
PV Maintenance
[$] |
-10,350 |
-800 |
-751 |
-705 |
-661 |
-621 |
…. |
-175 |
|
Capital Expenditure [$] |
-96,667 |
|
|
|
|
|
|
|
|
GoA Manpower [$] |
-72,500 |
|
|
|
|
|
|
|
|
Decommissioning [$] |
-4,218 |
|
|
|
|
|
|
|
|
Energy saving [$] |
32,640 |
|
|
|
|
|
|
|
|
Tax recovery [$] |
171,452 |
|
|
|
|
|
|
|
|
CO2 claim
[$] |
2,722 |
|
|
|
|
|
|
|
|
Project PV
[$] |
20,357 |
|
|
|
|
|
|
|
|
Project Simple Payback [y] |
21 |
|
|
|
|
|
|
|
Table R.4: Summary
of the business case for the DoE alternative
|
Eng |
|
|
|
|
|
|
|
|
|
Year |
0 |
1 |
2 |
3 |
4 |
5 |
…. |
25 |
|
PV Maintenance
[$] |
-10,350 |
-800 |
-751 |
-705 |
-661 |
-621 |
…. |
-175 |
|
Capital Expenditure [$] |
-171,667 |
|
|
|
|
|
|
|
|
GoA Manpower [$] |
-42,500 |
|
|
|
|
|
|
|
|
Decommissioning [$] |
-4,218 |
|
|
|
|
|
|
|
|
Energy saving [$] |
32,640 |
|
|
|
|
|
|
|
|
Tax recovery [$] |
171,452 |
|
|
|
|
|
|
|
|
CO2 claim
[$] |
2,722 |
|
|
|
|
|
|
|
|
Project PV
[$] |
-24,643 |
|
|
|
|
|
|
|
|
Project Simple Payback [y] |
> project life |
|
|
|
|
|
|
|
Table R.5: Summary
of the business case for the Eng alternative
|
Com |
|
|
|
|
|
|
|
|
|
Year |
0 |
1 |
2 |
3 |
4 |
5 |
…. |
25 |
|
PV Maintenance
[$] |
-5,175 |
-400 |
-375 |
-352 |
-331 |
-310 |
…. |
-87 |
|
Capital Expenditure [$] |
-96,667 |
|
|
|
|
|
|
|
|
GoA Manpower [$] |
-34,167 |
|
|
|
|
|
|
|
|
Decommissioning [$] |
-4,218 |
|
|
|
|
|
|
|
|
Energy saving [$] |
32,640 |
|
|
|
|
|
|
|
|
Tax recovery [$] |
171,452 |
|
|
|
|
|
|
|
|
CO2 claim
[$] |
2,722 |
|
|
|
|
|
|
|
|
Project PV
[$] |
63,866 |
|
|
|
|
|
|
|
|
Project Simple Payback [y] |
14.5 |
|
|
|
|
|
|
|
Table R.6: Summary
of the business case for the Com alternative
|
Part |
|
|
|
|
|
|
|
|
|
Year |
0 |
1 |
2 |
3 |
4 |
5 |
…. |
25 |
|
PV Maintenance
[$] |
-$3,234 |
-250 |
-235 |
-220 |
-207 |
-194 |
…. |
-55 |
|
Capital Expenditure [$] |
-$64,027 |
|
|
|
|
|
|
|
|
GoA Manpower [$] |
-34,167 |
|
|
|
|
|
|
|
|
Decommissioning [$] |
-4,218 |
|
|
|
|
|
|
|
|
Energy saving [$] |
0 |
|
|
|
|
|
|
|
|
Tax recovery [$] |
171,452 |
|
|
|
|
|
|
|
|
CO2 claim
[$] |
2,722 |
|
|
|
|
|
|
|
|
Project PV
[$] |
65,806 |
|
|
|
|
|
|
|
|
Project Simple Payback [y] |
14 |
|
|
|
|
|
|
|
Table R.7: Summary of
the business case for the Part alternative
Figure S.1: GoA alternative, it takes around 476 business
days to be completed.
Figure S.2: Eng alternative, it takes around 479 business
days to be completed.
Figure S.3: Com and Part alternatives, they take around 396
business days to be completed.
[1] The largest world Wind power plant is in Texas (Horse Hollow) with a
nominal capacity of 735 MW. The world wide capacity Wind installation is 121 GW
with an average capacity factor of 34%, which means around 360 TW.
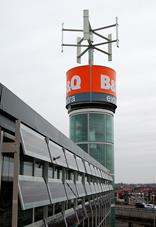
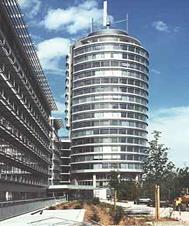
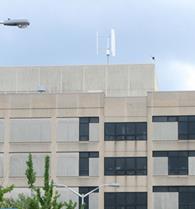
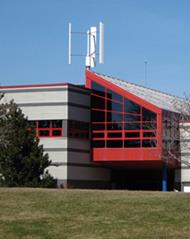
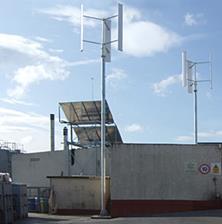
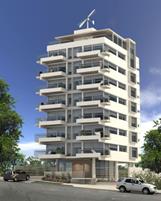
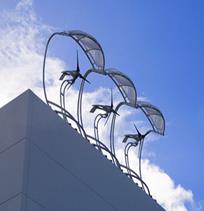
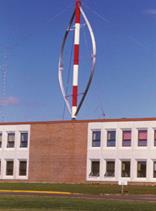
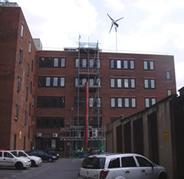
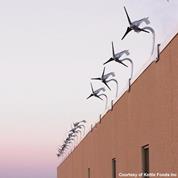
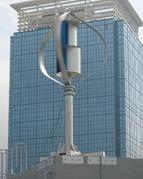
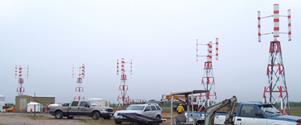
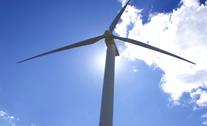
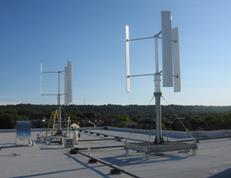
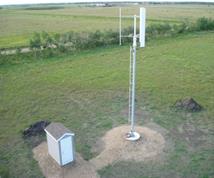